
Fig. 6.
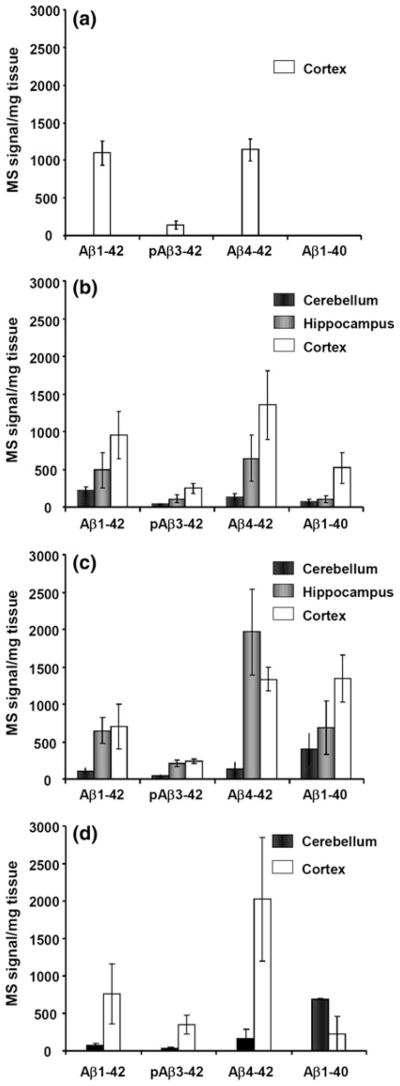
The MS signal/mg tissue is displayed for a controls, b SAD, c APP670/671 and d PSEN1 patients. The error bars represent one standard of the mean. It should be noted that the ratio between the different isoforms detected in the mass spectrum cannot be interpreted as a direct reflection of their absolute or relative abundance in the brain since the ionization efficiency might be different for the different isoforms and since different isoforms are more hydrophobic and less soluble than others