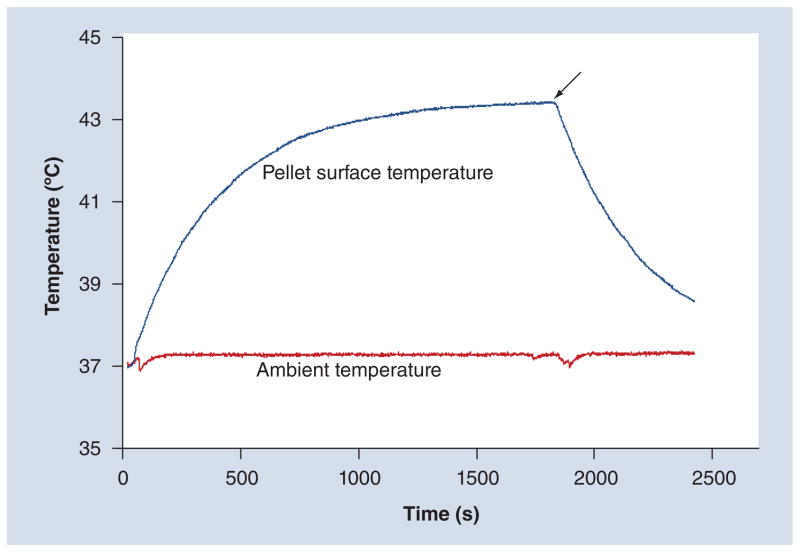
Figure 4. Dynamic temperature profile of cell pellet.
Measured surface temperature profile during alternating magnetic field treatment for a 500,000 cell cluster with an iron content of 199 pg/cell (cells were allowed to equilibrate to 37°C in sample chamber for 10 min before the power was turned on; the arrow indicates when the power was turned off).

