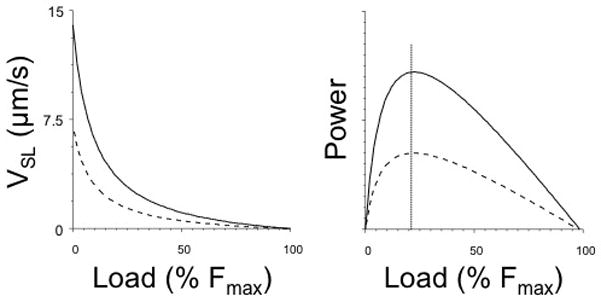
Figure 2.

Force-sarcomere velocity relationships (left panel) and Force-Power relationships (right panel) determined in isolated rat myocardium composed of predominantly α myosin (solid lines) or β myosin (dashed lines). Expression of the slower β myosin results in reduced sarcomere shortening velocity at all mechanical loads as well as reduced power development. Maximum power is generated at ~30% Fmax as indicated by the vertical dotted line. Modified from (de Tombe and ter Keurs, 1991a).
