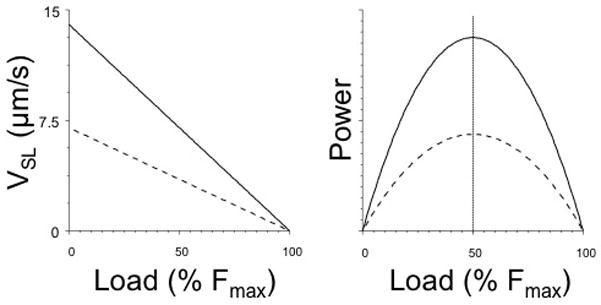
Figure 3.

Average single cross bridge Force-sarcomere velocity relationships (left panel) and Force-Power relationships (right panel) prediction based on measurement of sarcomere stiffness during sarcomere shortening for α myosin (solid lines) or β myosin (dashed lines). The attached cycling cross bridges behave mechanically as a visco-elastic unit, where shortening velocity is linearly inversely proportional to muscle load. Maximum power at the single cross bridge level is generated at 50% Fmax as indicated by the vertical dotted line. Modified from (de Tombe and ter Keurs, 1992; de Tombe and ter Keurs, 1991a; ter Keurs et al., 2010).
