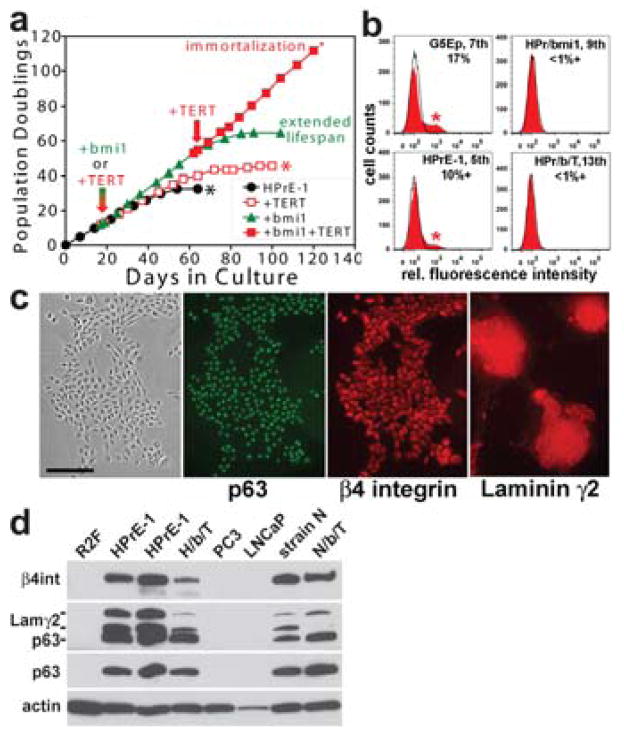
Figure 5. Characteristics of experimentally immortalized human prostate epithelial cells.
a. HPrE-1 was transduced early in its lifespan (indicated by the red/green arrow) to express either bmi1 or TERT. Note that untransduced HPrE-1 cells senesced after 33 PD, HPrE-1/TERT cells did not become immortalized and senesced after 43 PD, but that HPrE-1/bmi1 cells displayed a long extended lifespan totaling 63 PD. HPrE-1/bmi1 cells subsequently transduced to express TERT (at the point in their lifespan indicated by the red arrow) grew progressively and at a constant growth rate for >115 PD, indicating immortalization.
b. Flow cytometric analysis of p16INK4A expression in normal primary and immortalized prostate epithelial cells. G5Ep keratinocytes at 7th passage (at ~50 PD of their 70 PD lifespan), HPrE-1 cells at 5th passage (at ~22 PD of their 33 PD lifespan), HPrE-1/bmi1 cells at 9th passage (at ~45 PD of their 63 PD lifespan), and immortalized HPrE-1/bmi1/TERT cells at 13th passage (~65 PD) were analyzed for p16INK4A expression. Fluorescence intensity of cells incubated with non-immune IgG isotype control is shown by the black line and p16INK4A immunofluorescence intensity of the population shown by the solid red curve. Note p16+ cells indicated by asterisk in the G5Ep and HPrE-1 panels, representing 17% and 10% of these populations, respectively, and absence of p16+ cells in the HPrE-1/bmi1 and HPrE-1/bmi1/TERT cultures.
c. Immunofluorescence staining of HPrE-1/bmi1/TERT cells after 90 PD. Note p63, β4 integrin, and Lam332 expression in all cells. Bar in left panel: 200 microns.
d. Western blot analysis of p63, Laminin γ2, and β4 integrin expression. Total protein extracts of preconfluent cultures were analyzed. Early- and mid-lifespan cultures of HPrE-1 are shown in the two lanes labeled HPrE-1. H/b/T: HPrE-1/bmi1/TERT. N/b/T: N/bmi1/TERT. The two bands of γ2 are the 155kd unprocessed form and the 105 kd processed, mature form of this subunit of Lam332. Note expression of p63, Laminin γ2, and β4 integrin by HPrE-1/bmi1/TERT cells (albeit with lower levels of Laminin γ2 and β4 integrin than the HPrE-1 parent line), in contrast to undetectable expression by PC3 and LNCaP prostate carcinoma cells. The strain N epidermal keratinocyte line and its bmi1/TERT-immortalized derivative displayed similar levels of p63, β4 integrin, and γ2 expression.

