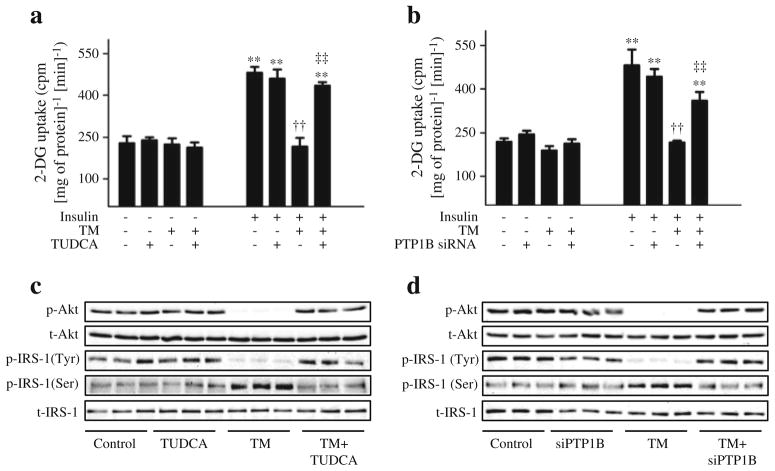
Fig. 8.
The role of PTP1B and ER stress in tunicamycin (TM)-induced insulin resistance. C2C12 myotubes were incubated with TM and treated with TUDCA (a, c) or Ptp1b siRNA (b, d) for 24 h (48 h for siRNA experiment), and stimulated with insulin (50 nmol/l, 30 min). (a, b) 2-Deoxy[3H]glucose uptake assay (mean ± SEM, n=3). **p< 0.01 compared with corresponding no-insulin conditions; ††p<0.01 compared with insulin-stimulated cells; ‡‡p<0.01 compared with TM + insulin treated cells. (c, d) Western blot analysis of phospho-and total Akt (p-Akt and t-Akt, respectively) and phospho- and total-IRS-1 (p-IRS-1 (Tyr1222 and Ser307 and t-IRS, respectively) protein levels. Representative blots are shown

