
FIG. 5.
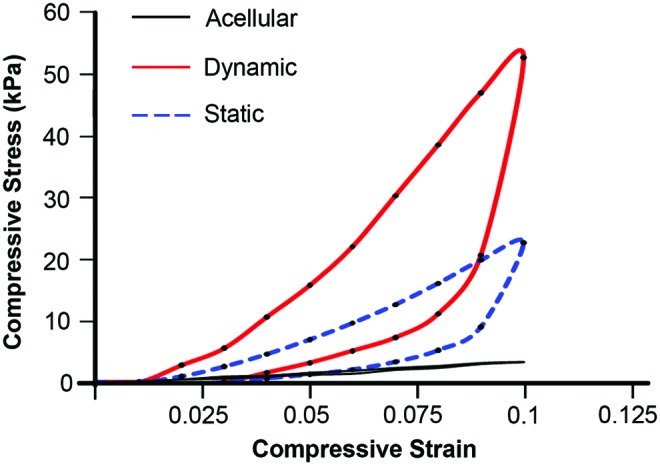
Representative compressive stress–strain curves of the AC/OB constructs that had been subjected to dynamic culture (red solid line) or static culture (blue dotted line) for 2 weeks demonstrating improved mechanical properties of engineered osteochondral constructs by biomechanical stimulation. Black solid line represents a stress–strain curve of acellular scaffolds. Static and dynamic represent static culture and dynamic culture subjected to 10% cyclic compressive strain at 1 Hz for 3 h/day, respectively. Color images available online at www.liebertpub.com/tea