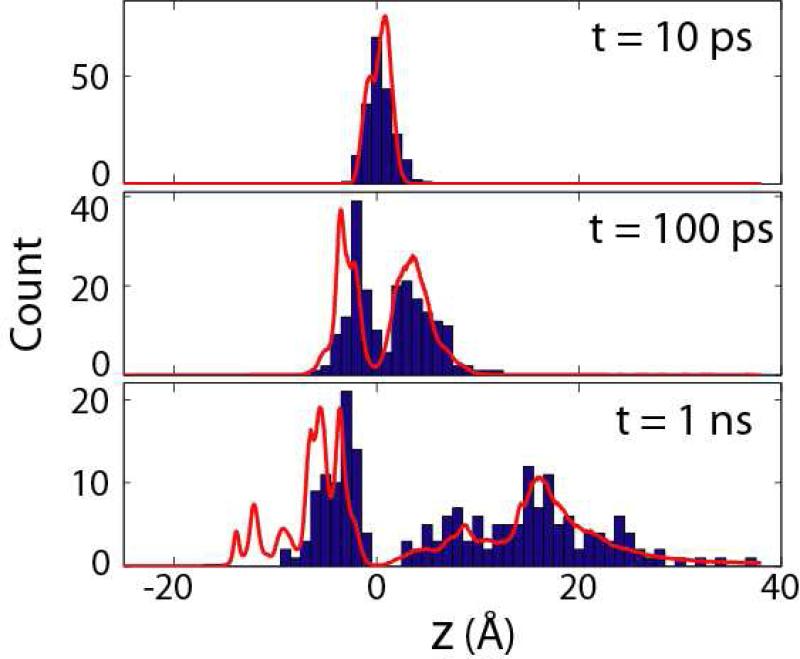
Figure 4.
Histograms for the z -coordinates of the ion in the 200 trajectories, at three lag times (10 ps, 100 ps, 1 ns) after the start of the simulations. The red curves represent the prediction from the numerical solution45 of the diffusion equation (Eq. 10) using the calculated PMF (Fig. 2a) and D(z) (Fig. 3a).

