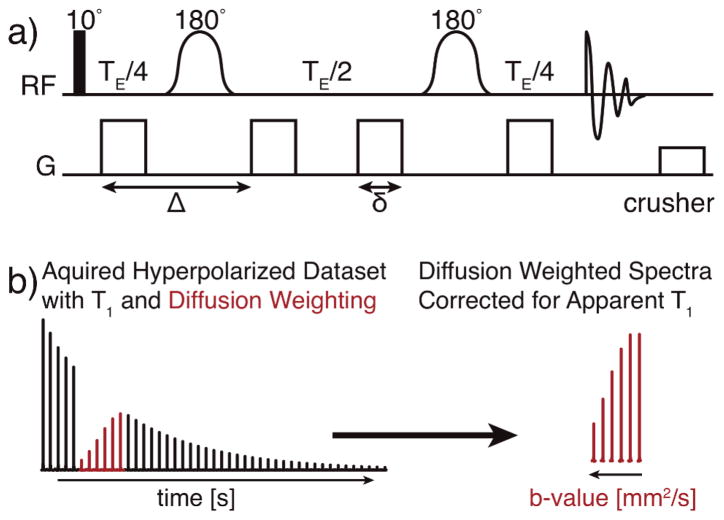
Fig. 1.
(a) The pulsed gradient double spin echo pulse sequence used for hyperpolarized diffusion experiments, with a 10° excitation pulse and adiabatic 180° pulses. (b) Representative spectra for which the apparent T1 (black) and hyperpolarized diffusion measurements (red) are interleaved. Correcting the hyperpolarized diffusion weighted spectra for the T1 enables an accurate calculation of diffusion coefficient for the hyperpolarized molecules.

