
Table 1.
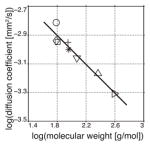
Diffusion Coefficients (D) and relaxation times (T1) of hyperpolarized 13C molecules measured in aqueous solution.
| Molecule | MW [g/mol] | T1 [s]a | D [10−3 mm2/s]b | Literature D [10−3 mm2/s]c | |
|---|---|---|---|---|---|
| 13C urea (○) | 61.05 | 35.3±2.6 | 1.54±0.06 | 1.4518 |
|
| [1-13C] acetate (⋄) | 61.04 | 46.2±0.7 | 1.15±0.03 | 1.1519 | |
| [1-13C,d3] acetate (□) | 64.04 | 49.9±1.7 | 1.13±0.02 | — | |
| [1-13C] pyruvate (+) | 89.05 | 43.8±3.3 | 1.12±0.04 | — | |
| [1-13C] lactate (✳) | 91.07 | 32.3±0.7 | 1.00±0.01 | 1.1220 | |
| N-[acetyl-1-13C] glycine (▽) | 118.10 | 16.9±0.8 | 0.87±0.07 | 1.11*,21 | |
| N-[acetyl-1-13C,d3] triglycine (△) | 232.20 | 9.9±0.7 | 0.68±0.04 | 0.70*,21 | |
| N-[acetyl-1-13C,d3] RGD (▷) | 391.37 | 5.4±0.8 | 0.49±0.03d | — |
a
T1 relaxation times are at 14.1 T/150 MHz for 13C.
b
Measurements at 27°C.
c
Literature references cite diffusion coefficients of either exactly the compound or a similar compound (marked with *), e.g., the diffusion coefficient for triglycine as compared to N-acetyl-triglycine. All literature values were adjusted for temperature using the Stokes-Einstein equation.
d
A 12 hr diffusion acquisition of thermally polarized N-acetyl-RGD (0.47×10⁻³ mm2/s) corresponds with this diffusion coefficient. Mean ± SD, n = 3.