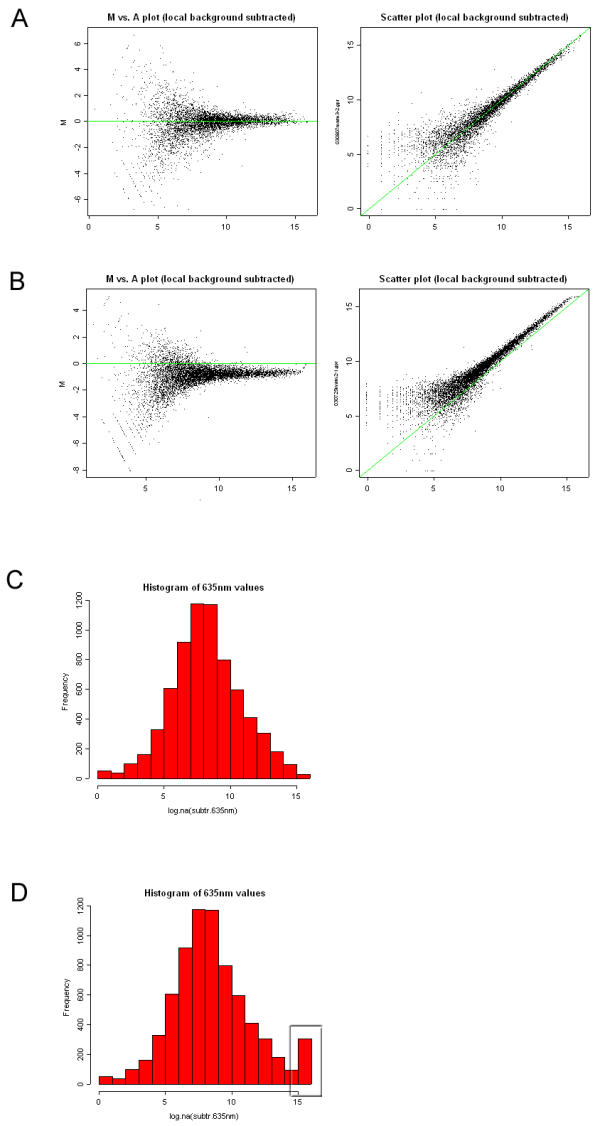
Figure 2.

Diagnostic report. A + B) The diagnostic method generates scatter plots of the dual color hybridization data, both as MvA plots and red/green-scatter plots. In these plots the green line represents M = 0 and red = green respectively, making it easy to assess the balance between the green and the red channel. C + D) The distribution of log2 transformed intensities from the individual channels are visualized by plotting the data as histograms. Finally, the report contains information on the files used to generate the diagnostic plots, the number of saturated spots, and the number of negative spots (background is higher than foreground).
