Fig. 1.
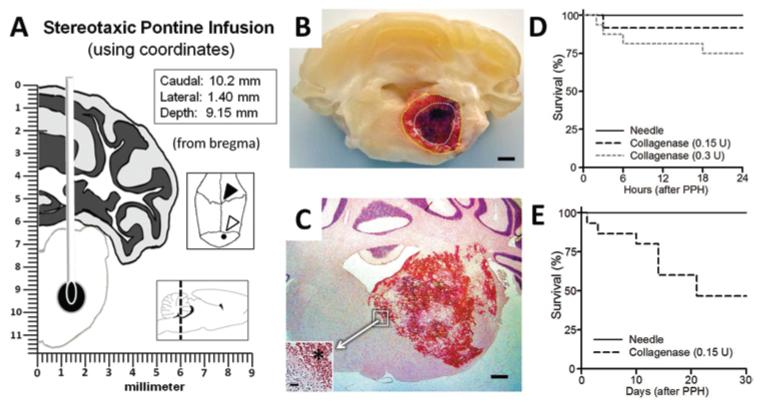
Experimental model of pontine hemorrhage in the rat. A: Schematic showing stereotactic needle placement into the right ventral pontine tegmentum (Insets: coordinates [upper]; cranial aspect of bregma [open arrowhead] and the infusion site [closed arrowhead]; sagittal demonstration with the dotted line at craniocaudal level of infusion [lower]). B: Photograph of coronal section of tissue at 24 hours after collagenase (0.15 U) infusion, showing the hematoma surrounded by vasogenic edema (outlined with dotted lines). Bar = 1 mm. C: Representative H & E-stained cryosection (12 hours, 0.3 U collagenase) illustrating the hemorrhage. Bar = 0.5 mm. (Inset showing the hematoma border [asterisk]. Bar = 20 μm.) D and E: Gehan-Breslow survival analysis results at 24 hours and 30 days.

