Fig. 5.
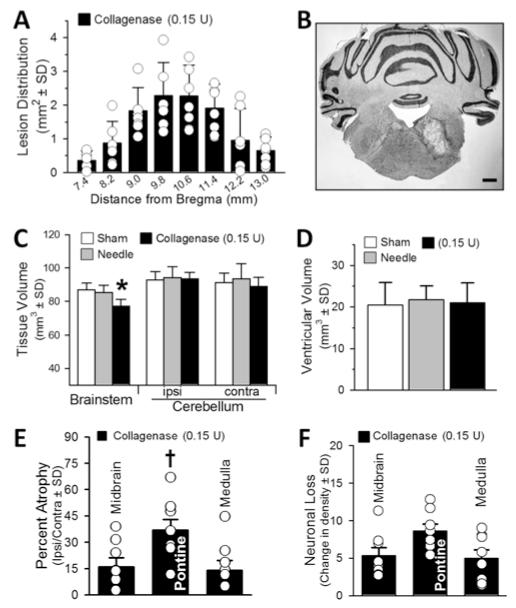
Histopathological results at 30 days. A: Lesion distribution (in mm2) throughout the brainstem. B: Representative cryosection illustrating the cystic cavitary lesion. Bar = 1 mm. C: Infratentorial brain tissue volume (in mm3). D: Volume of the ventricles (in mm3). E: Percentage of atrophy of the brainstem (midbrain, pontine, and medulla), expressed as the volumetric difference between ipsilateral and contralateral sides. F: Neuronal density loss over the intact (perilesional) brainstem regions expressed as average difference in cell counts between ipsilateral and contralateral sides. Values expressed as the mean ± SD (n = 8 [sham and needle trauma] and n = 7 [collagenase infusion, 0.15 U]). *p < 0.05 compared with controls (sham and needle). †p < 0.05 compared with midbrain and medulla (percentage of atrophy).

