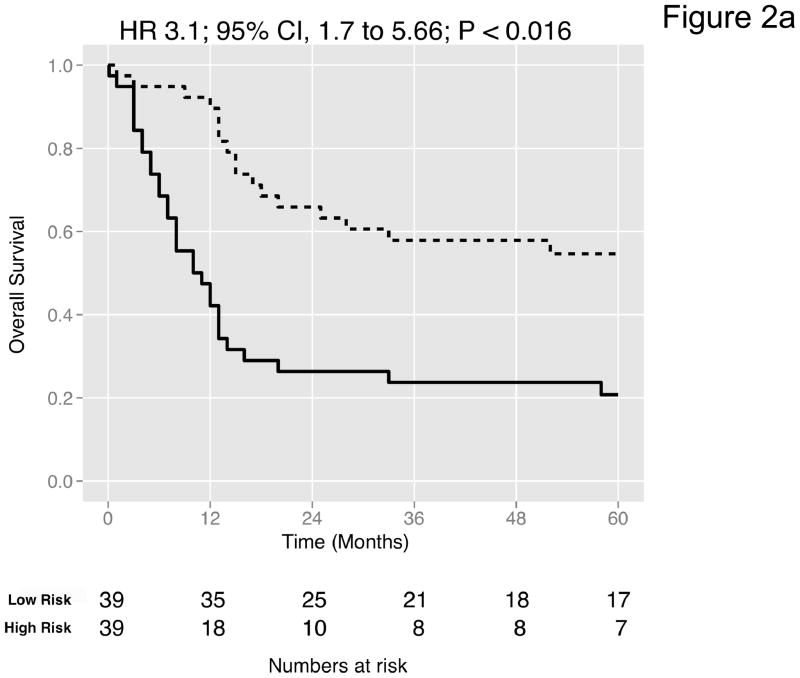
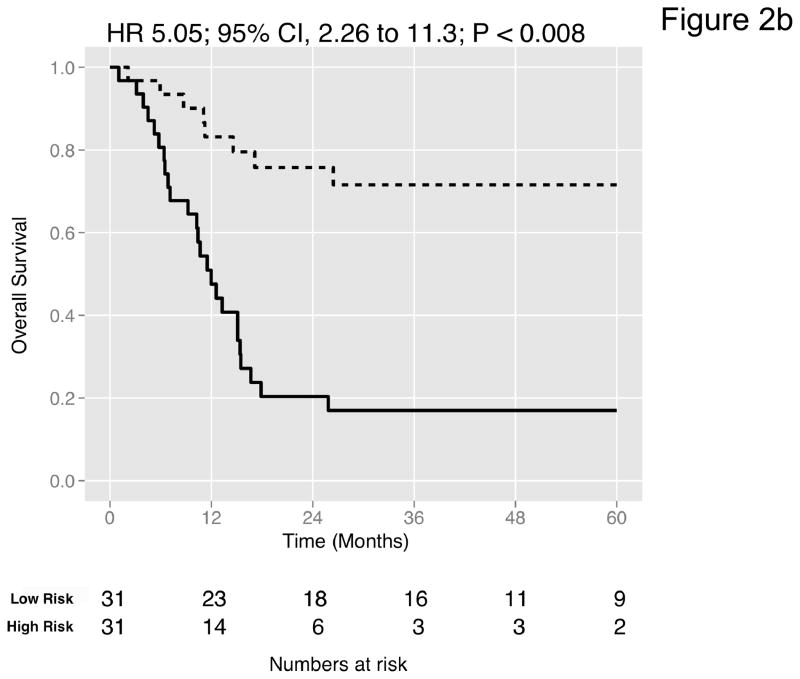
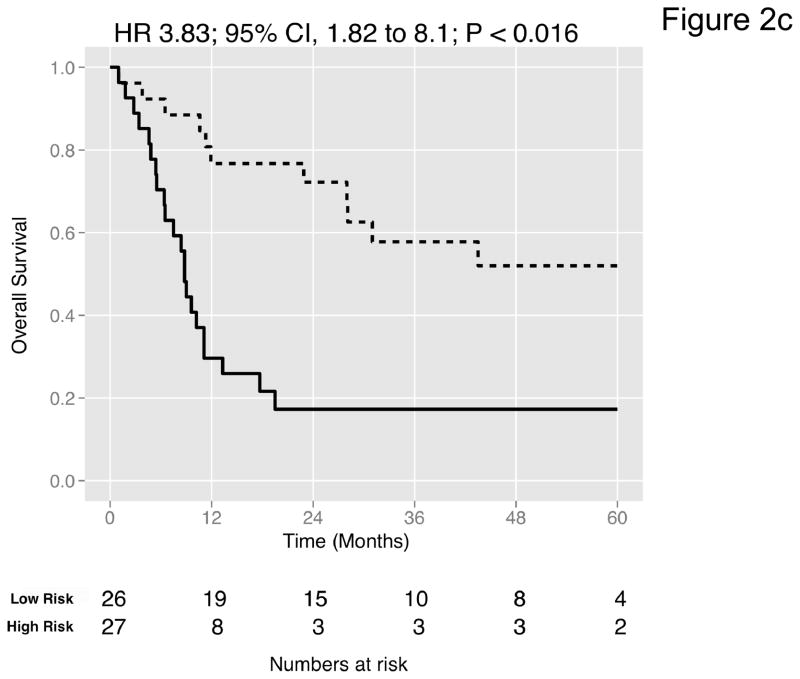
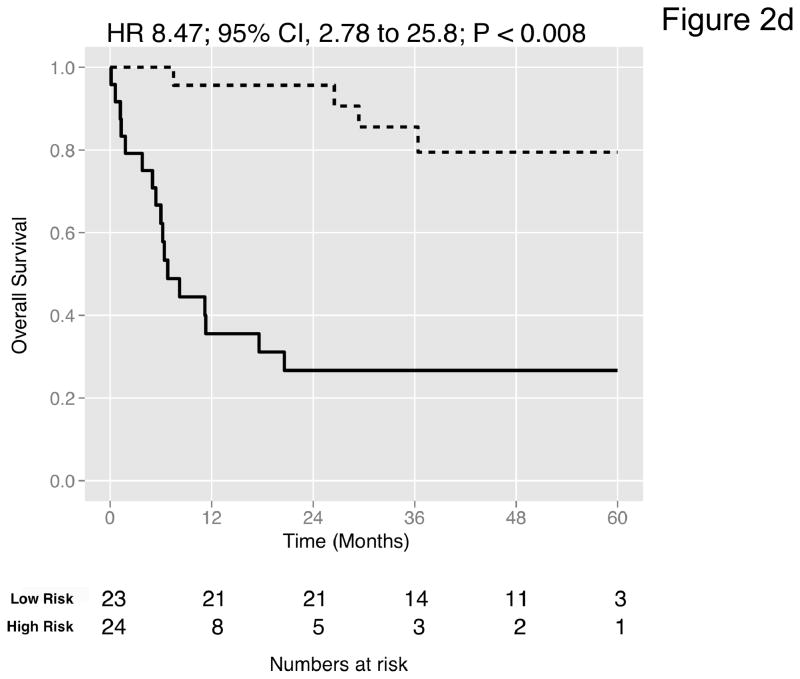
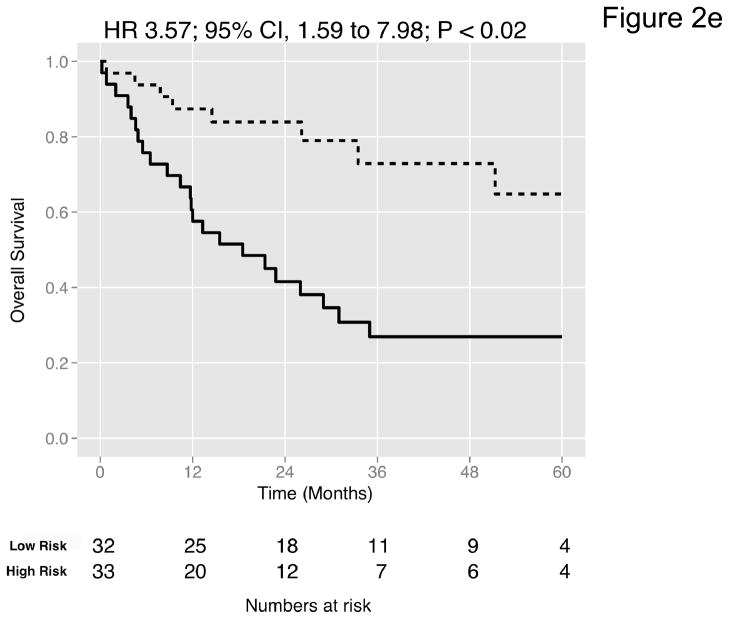
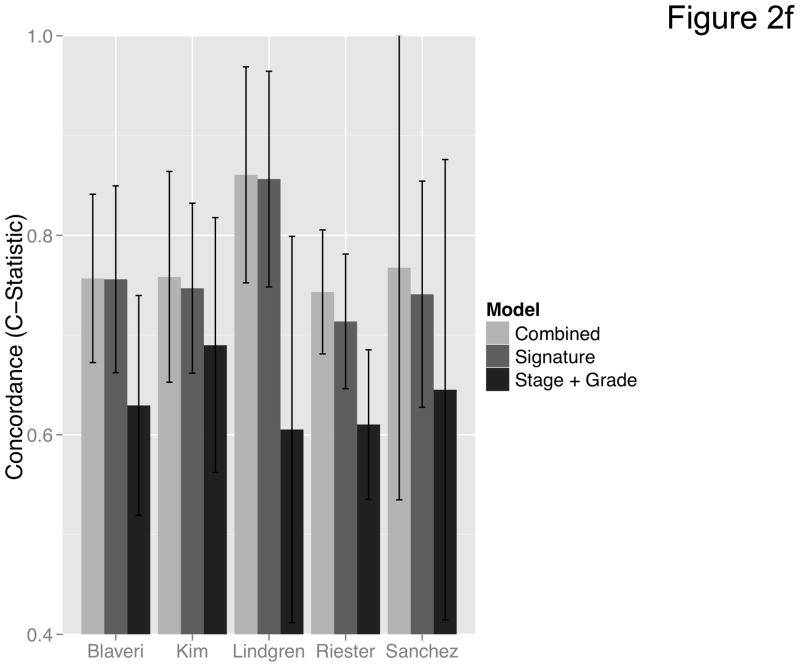
Figure 2. Prediction accuracy of our novel gene signature.
(a–e) Kaplan-Meier plots for low-and high-risk groups in five datasets. Hazard ratios (HRs) indicate how well the signature separates tumors. A HR of 3.1, for example, corresponds to 3.1-fold increase in risk for the high-risk group. Some genes were not present on all microarray platforms. The novel signature is shown in Table 4. (a) Riester (all 20 genes); (b) Blaveri (18 genes); (c) Kim (20 genes); (d) Lindgren (10 genes); (e) Sanchez-Carbayo (20 genes). In all plots, patients were stratified in two equally sized groups by the cohort medians of the calculated risk scores. We further tested whether the gene signature improves the predictive utility of stage and grade, two established predictors available for all 5 datasets. This comparison was done by analyzing the concordance (C-statistic, (22)) of the models. A concordance of 0.5 corresponds to a random model, one of 1.0 of a perfect model. (f) C-statistics for all 5 datasets for a multivariate model with stage, grade and the gene signature risk score; for model with gene signature risk score alone; and for a model with only stage and grade. Error bars indicate 95% confidence intervals.

