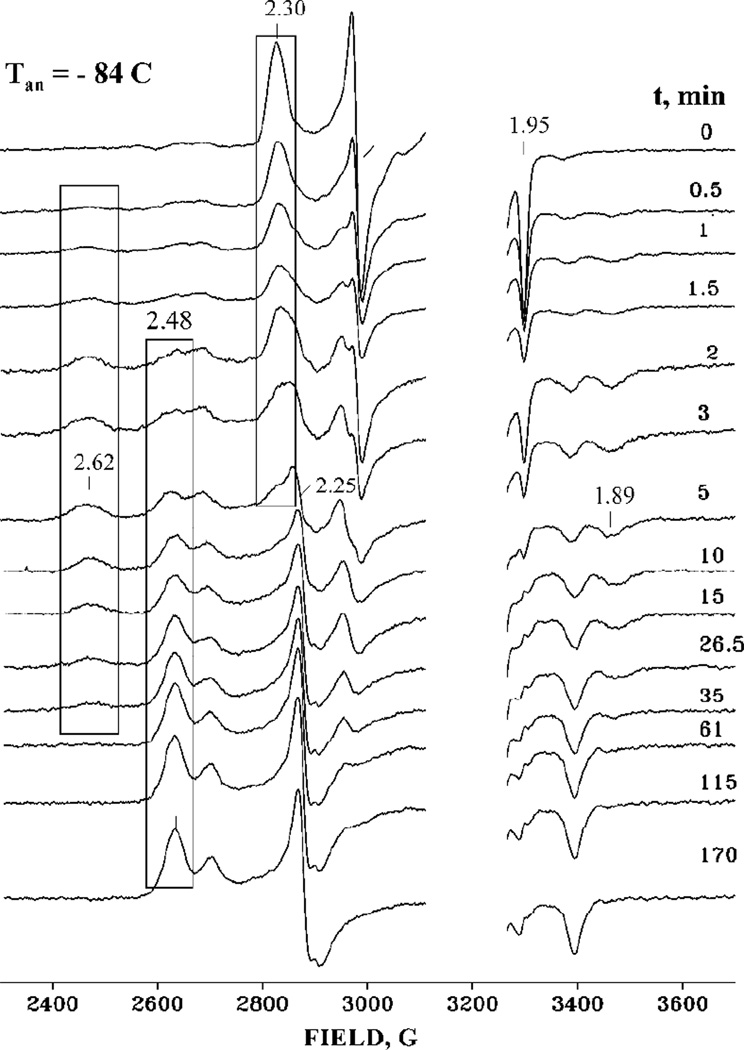
Figure 1.
X-band EPR spectra of cryoreduced oxyferrous P450cam-camphor complex taken during progressive annealing at 190 K at indicated times. Blue boxes isolate the loss of the signal at g = 2.30 from the hyrdoxoferric state, the appearance and loss of the g = 2.62 signal from the primary product state, and the appearance of the g = 2.48 signal from the relaxed product state. Instrument conditions: T = 29 K, MW frequency 9.369, MW power 13 db, modulation amplitude Am = 10 G.

