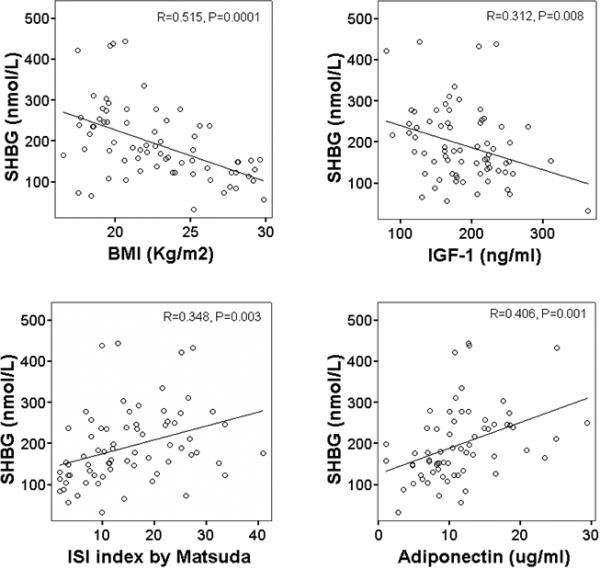
Figure 1.

Relationship between serum SHBG concentration and BMI (upper left panel), ISI by Matsuda and De Fronzo (upper right panel), serum IGF-1 concentration (lower left panel), and serum adiponectin concentration (lower right panel) in the study subjects. Pearson correlation was used to assess associations between continuous variables.
