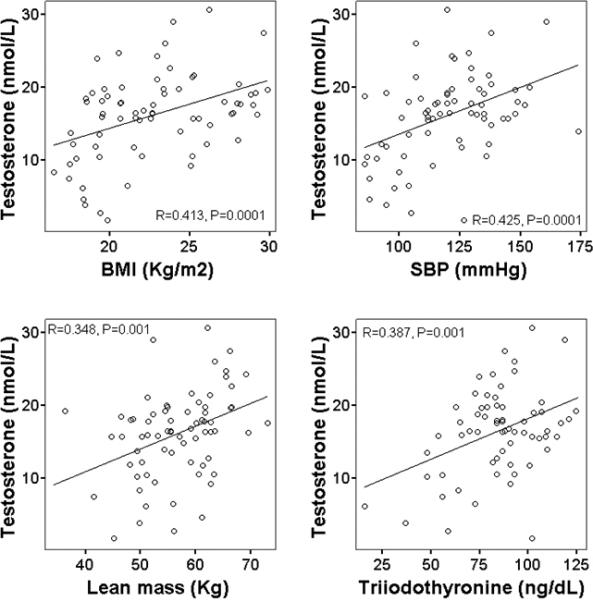
Figure 2.

Relationship between serum total testosterone concentration and BMI (upper left panel), systolic blood pressure (upper right panel), lean mass measured by DXA (lower left panel), and serum triiodothyronine concentration (lower right panel) in the study subjects. Pearson correlation was used to assess associations between continuous variables.
