Figure 2.
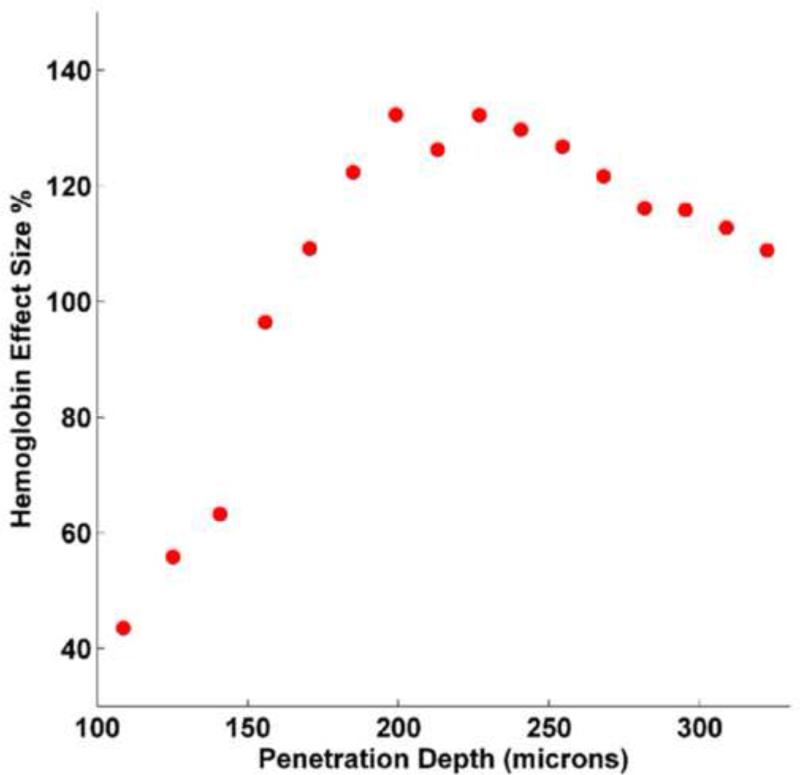
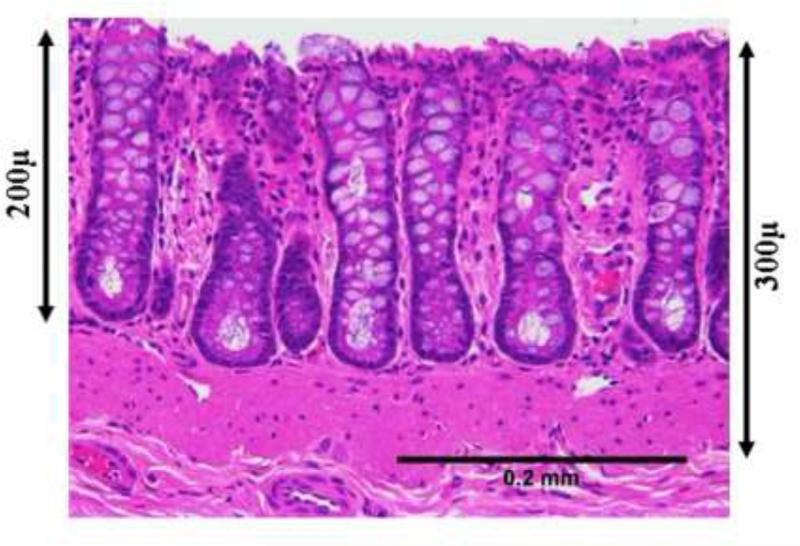
The depth of maximal mucosal hemoglobin concentrations co-localizes with the increase in MVD.
Fig 2a. Mucosal hemoglobin concentration was measured biophotonically with LEBS. The measures are the differential between AOM-treated and age-matched controls expressed as “effect size” expressed as a percentage. As can be seen, while at all depths there was a positive effect size with AOM (more hemoglobin), the maximal differential appeared to be at ~200-225 microns from tissue surface. As one probes deeper, there is a modest diminution in the AOM versus saline differences in hemoglobin.
Figure 2b: In order to understand the histological correlates for this ~200-225 microns optimal effect size in Hb we analyzed H&E stained sections of the colonic crypts were imaged at 20x magnification using an Olympus BH-2 brightfield microscope equipped with a SPOT camera. Scale bars were added using ImageJ software (NIH) to show various depths of the colonic mucosa. It appears that~200-225 microns from the tissue surface corresponds to the base of the crypts consistent with the hypothesis related to increased mucosal oxygen demand.


