Figure 2.
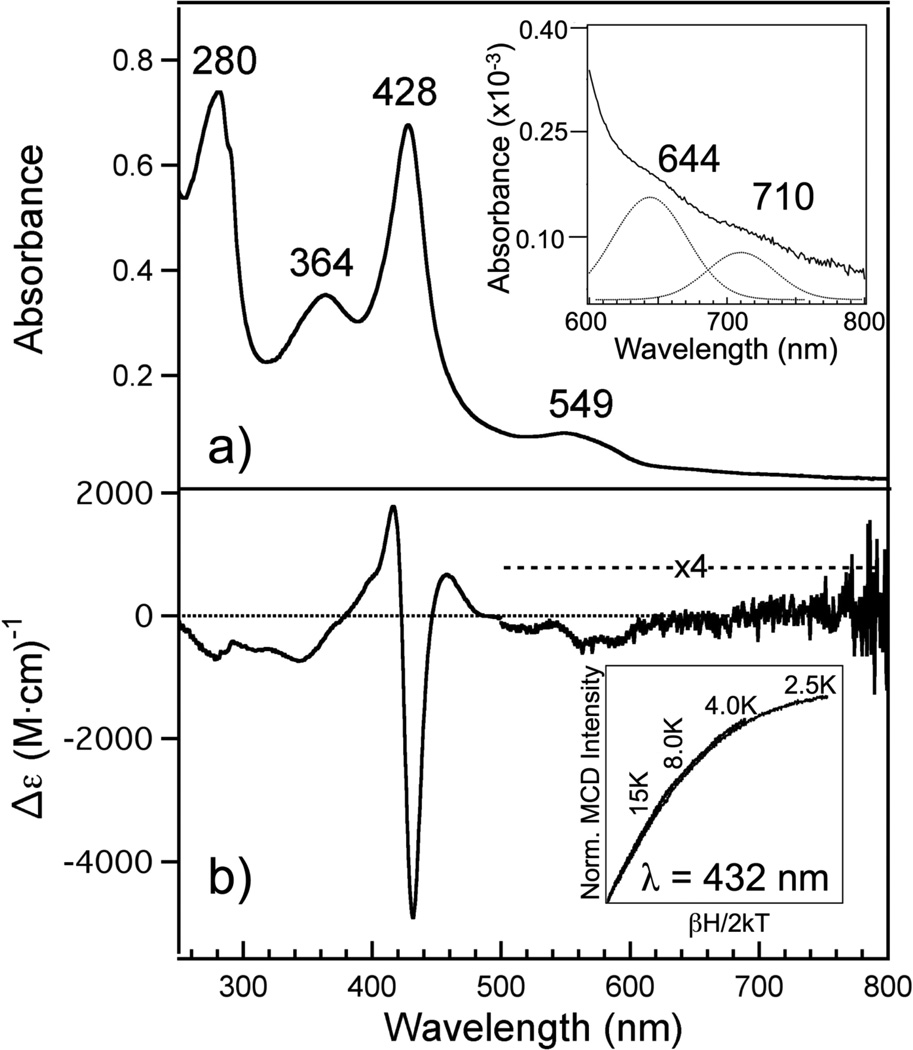
(A) Electronic absorption spectrum of Fe(III) R266K hCBS. Fe(III) R266K (7.8 µM) was in 100 mM CHES buffer and 100 mM NaCl, pH 8.6 at room temperature. Inset: close-up of the ligand-to-metal charge transfer (LMCT) transitions including the best-fit bands assuming a Gaussian peak shape (dotted). (B) MCD spectrum of Fe(III) R266K hCBS. Fe(III) R266K (15.7 µM) was in 100 mM CHES buffer, 100 mM NaCl and 55% glycerol (v/v) at 4.0 K and 7 T. Inset: the field dependence of the MCD intensity at 432 nm was recorded at 2.5, 4.0, 8.0 and 15 K. The curves were normalized to the most intense data point (2.5 K, 7 T).

