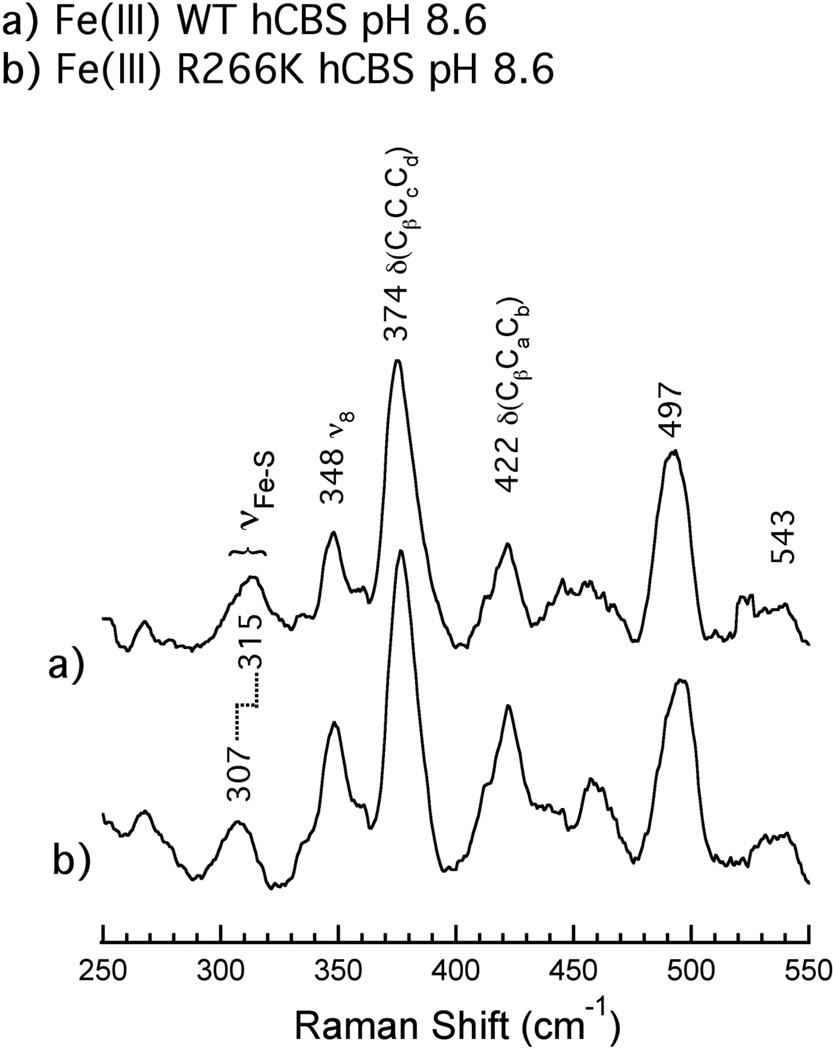
Figure 4.
Low frequency resonance Raman spectra of Fe(III) A) WT hCBS and B) R266K hCBS. Proteins (141 µM WT and 235 µM R266K) were in 100 mM CHES buffer and 100 mM NaCl, pH 8.6. Spectra were acquired using solution samples by excitation with a 413.1 nm line of a Kr+ laser with 10.5 mW power at the sample. All measurements were carried out with the sample immersed in a bath of ice water to reduce local heating. Peak positions were calibrated against a K2SO4 standard.

