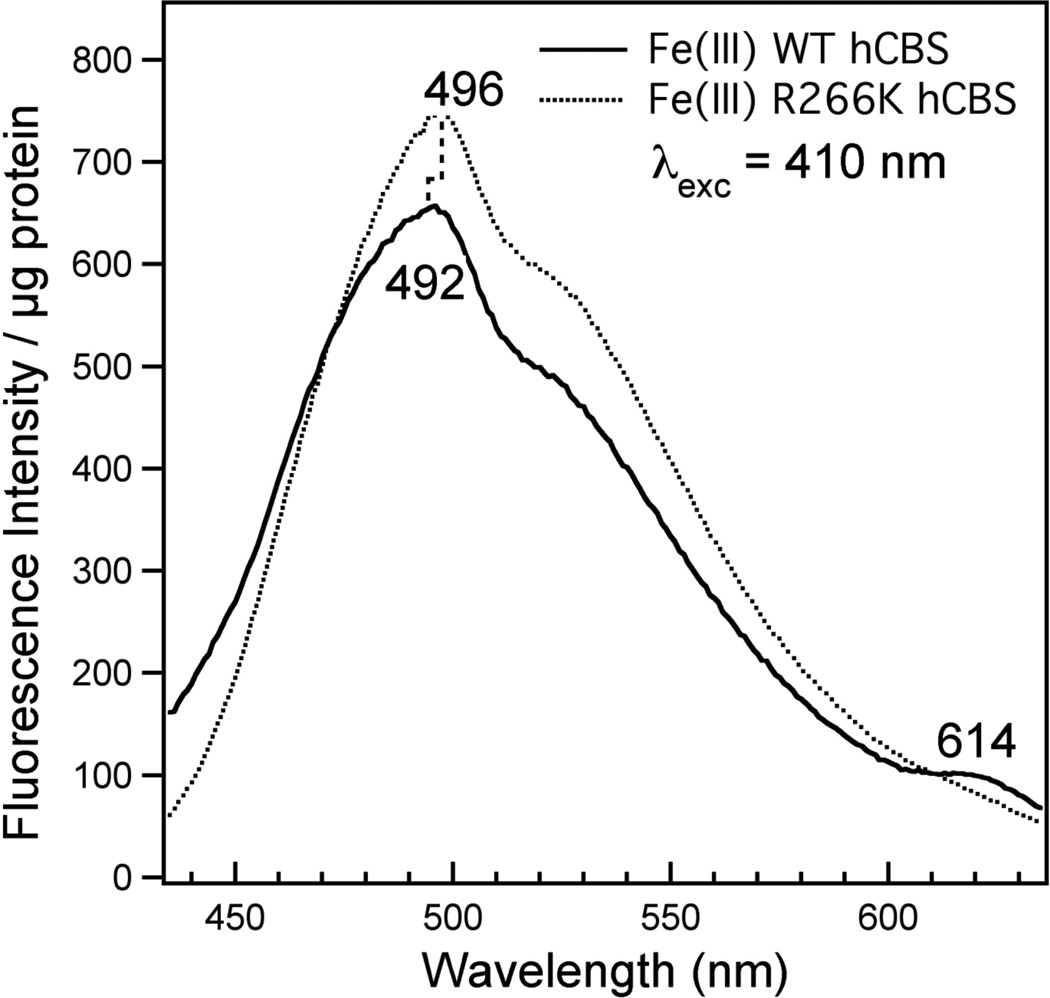
Figure 5.
Emission spectra of Fe(III) WT (solid line) and R266K (dotted line) hCBS. Proteins (7.4 µM WT and 10.4 µM R266K) were in 100 mM CHES buffer and 100 mM NaCl, pH 8.6 at room temperature. Emission spectra were recorded as follows: excitation at 410 nm with a 4 mm excitation slit width; output recorded from 425 nm to 635 nm with a 2 mm emission slit width. Total emission counts were normalized to protein concentration for each sample.

