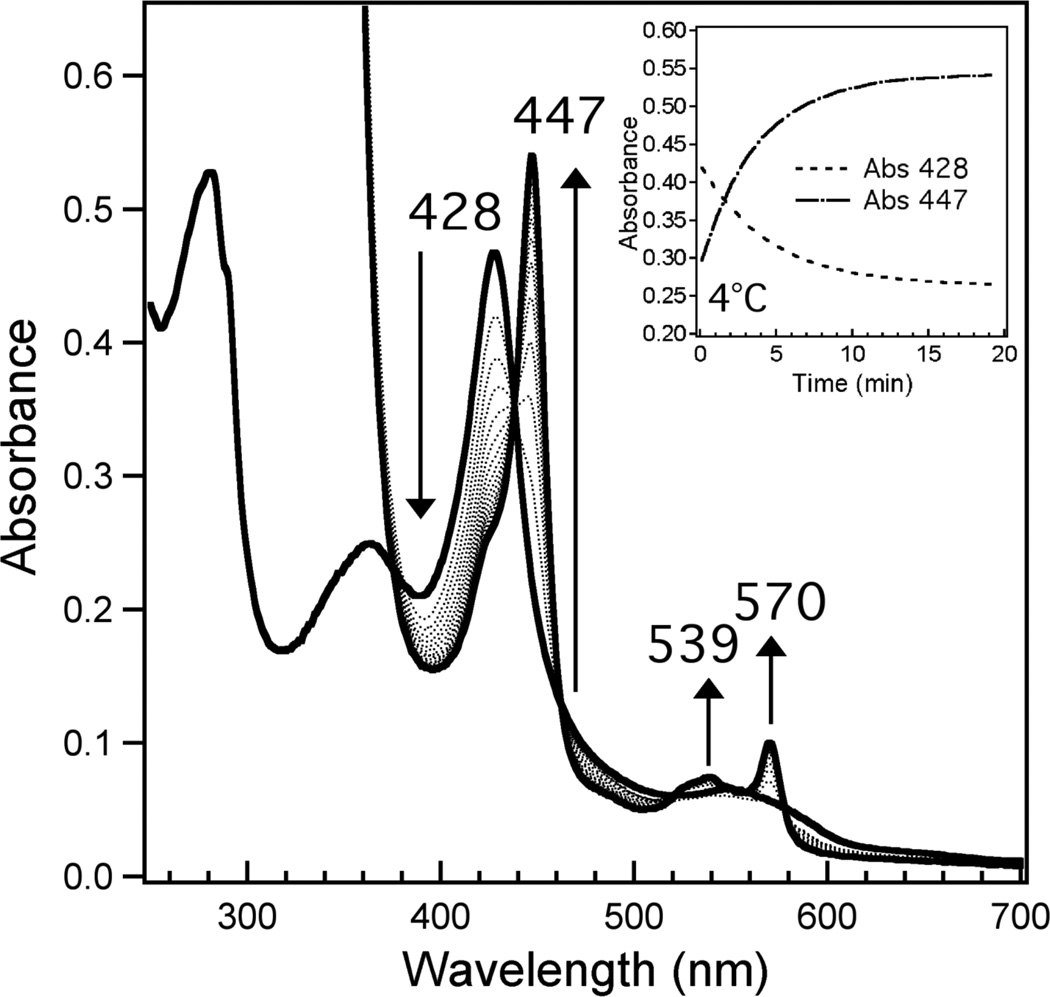
Figure 6.
Reduction process of Fe(III) to Fe(II) R266K hCBS at 4°C. Protein (7.8 µM) was in 100 mM CHES buffer, 100 mM NaCl, pH 8.6; the reduction process was initiated by addition of a stock solution of sodium dithionite to a final concentration of 1.5 mM. Solid lines indicate the initial (428 nm Soret) and final (447 nm Soret) spectra; dotted spectra were taken at 1 min intervals after addition of reductant. Inset: time course plots showing the loss of the Fe(III) Soret (428 nm, dashed) and the growth of the Fe(II) Soret (447 nm, dashed-dot) upon introduction of sodium dithionite at 4°C.

