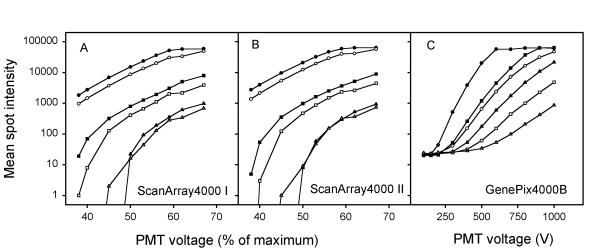
Figure 1.
Mean spot intensity versus PMT voltage for three scanners of two different brands, ScanArray4000 I (A), ScanArray4000 II (B), and GenePix4000B (C). Three representative spots are presented, one with high intensities (●, ○), one with intermediate intensities (■, □), and one with low intensities (▲, △). The intensities of the green and red channel are represented by closed and open symbols, respectively. The PMT voltage is given in % of maximum voltage for ScanArray4000 and in voltage for GenePix4000B.

