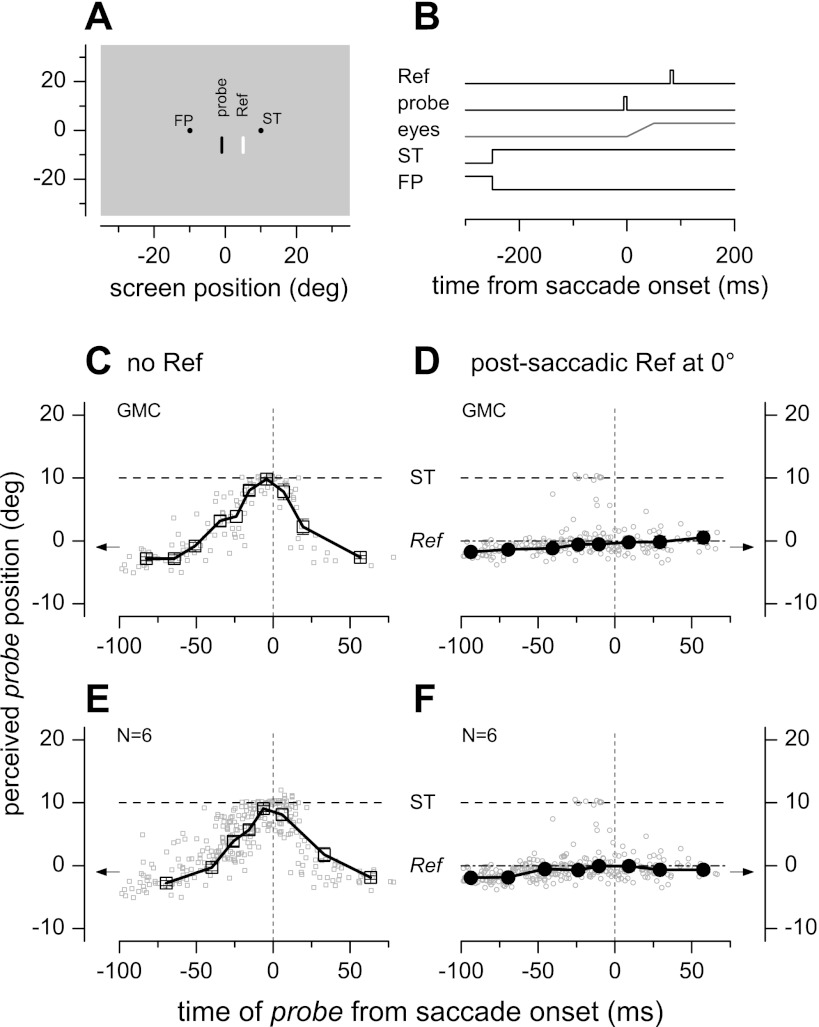
Fig. 1.
A: stimulus display, with the fixation point (FP), saccade target (ST), and 2 flashed bars: reference (Ref) and probe. B: time course of presentations. C–F: perisaccadic mislocalization for a probe bar at position −1°, either flashed alone (no Ref; C and E) or followed [stimulus onset asynchrony (SOA): 80 ms] by another briefly flashed bar at position 0° (D and F). The dash-dot horizontal lines show the location of the reference stimulus. The dashed horizontal line marks the location of the saccade target. The arrow indicates the screen position of the probe. Line-connected symbols plot the median reported probe position (median of data in subject GMC in C and D and pooled across 6 subjects in E and F; error bars represent SE computed by bootstrap and are often smaller than symbol size) against the delay of probe presentation from saccade onset (negative delays for presaccadic probes); and small gray symbols show single-trial data (total number of trials: 590 in E and F, distributed approximately equally across subjects).

