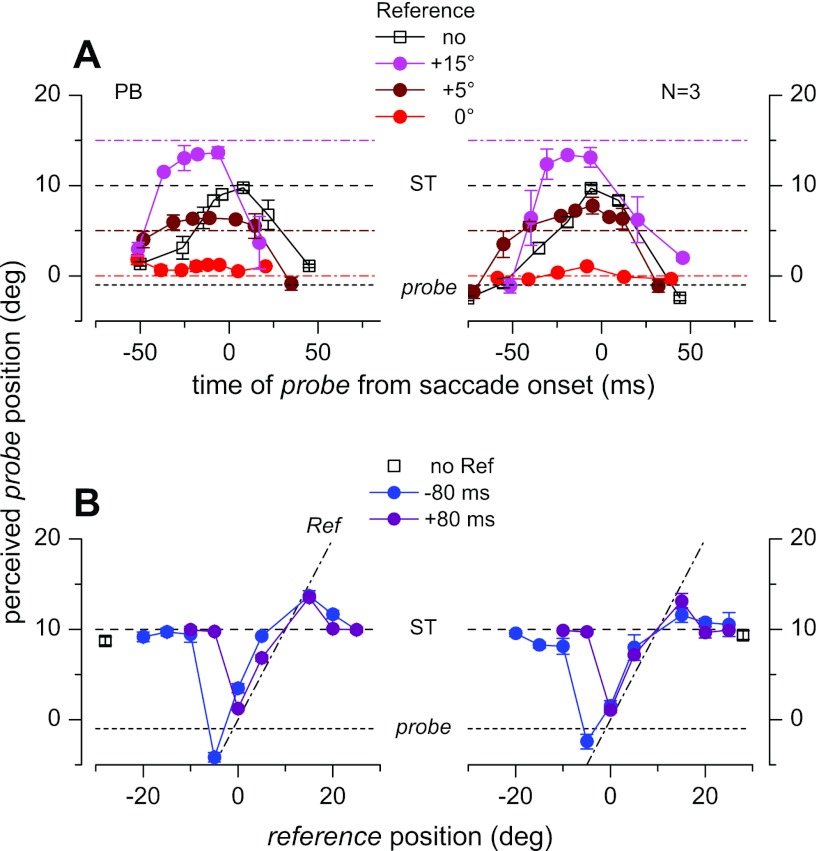
Fig. 7.
Perceived position of a probe presented at position −1° accompanied by references presented 80 ms before or after at various spatial positions. A: perceived probe position as a function of time for probes presented alone (open squares) or followed by a reference at 3 sample positions (color coded, reference position is marked by the horizontal dash-dot lines). B: trials for probe presentations between −20 and 0 ms. Perceived position is plotted as a function of the position of the reference, which preceded or followed the probe presentation by 80 ms (different colors). Perisaccadic probe apparent position in the absence of any reference stimulus is also reported (open squares). In both A and B, the black horizontal lines report the positions of the probe (dotted line) and the saccade target (dashed line). Left, data from 1 subject; right, data pooled across the 3 tested subjects (total number of trials: 2,500).

