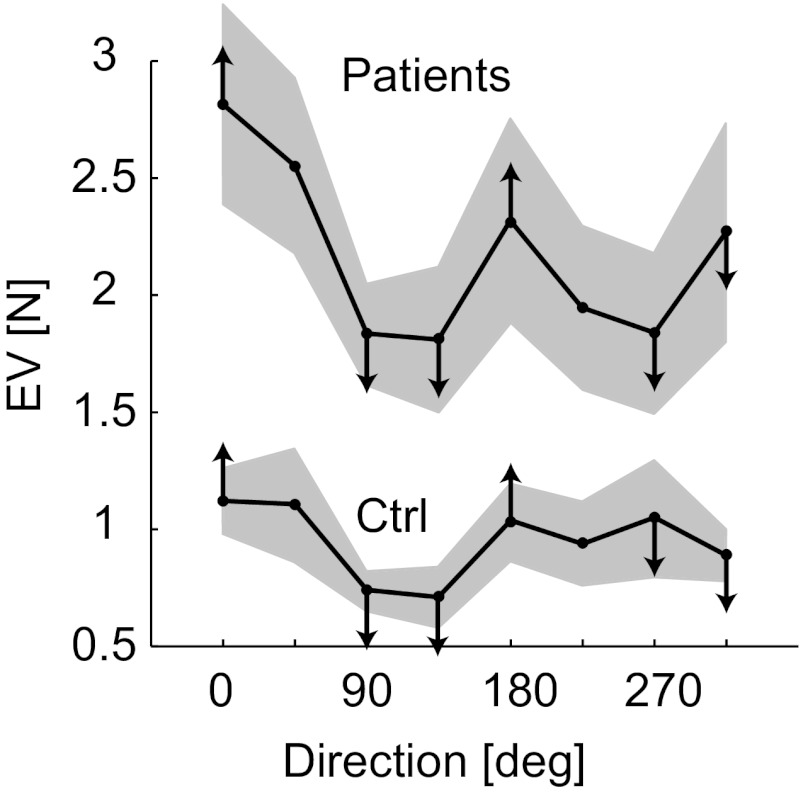
Fig. 8.
Performance varied with direction as predicted. Performance in the main experiment (EV averaged across all force magnitudes and blocks) is plotted as a function of target direction for patients and control subjects (θ in Fig. 2A). Gray bands represent ±1 SE across each group. Arrows indicate predicted error trends: arrows at 0 and 180° point toward high errors because those directions are associated with the highest cost in torque magnitude, while the other arrows point toward low errors because those directions are associated with low torque magnitude and/or single DOF (see Fig. 3, C and D).

