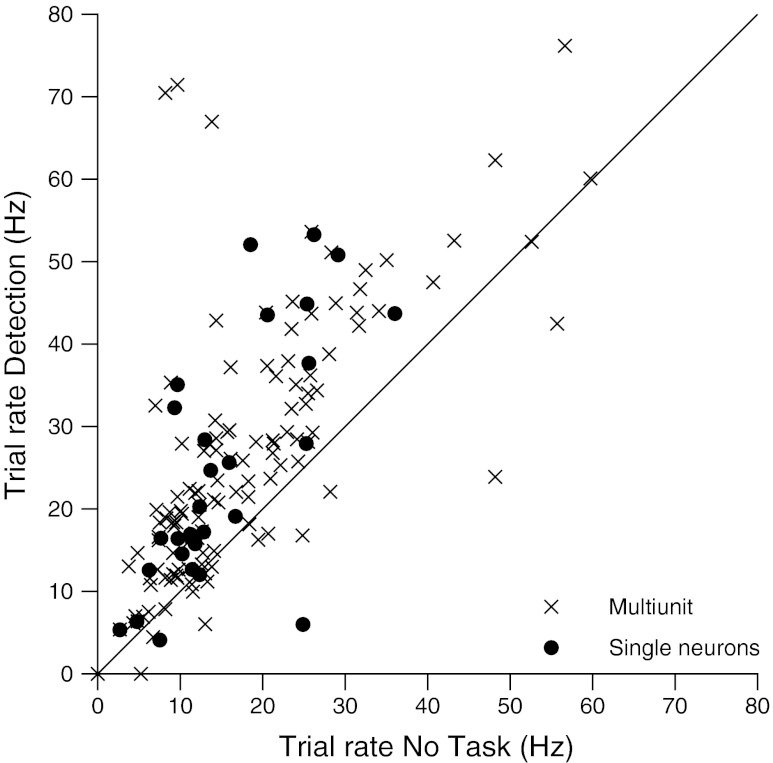
Fig. 3.
Mean trial rate No Task condition vs detection. For each data point, the mean trial rate during No Task condition animal data collection is the x coordinate, and the mean rate during detection performance is the y coordinate. Single units are plotted with filled circles. The 96 multiunit and 28 single unit recordings are plotted.

