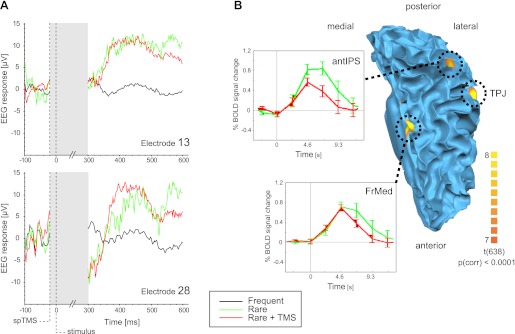
Fig. 10.

Human EEG and fMRI data (oddball task). A: average evoked EEG responses to the auditory stimulation conditions at parietal electrodes E13 (spherical coordinates: θ, 46.61; φ, −90) and E28 (spherical coordinates: θ, −70.64; φ, 52.95). In contrast to the frequently presented tone (black line), the rare oddball tone elicits a positive response with a 300- to 350-ms latency akin to the well-known P3b component [similar for trials in which no TMS was applied (green line) and when the tone was preceded by TMS (red line)]. Note that with the currently available hardware, the duration of the TMS-induced artifact in the EEG was ∼300 ms (indicated by shaded region). Shown curves represent epoched and baseline-corrected EEG traces without having applied any further preprocessing. B: top view on the cortical network involved in oddball detection projected on the participant's gray-white matter boundary surface of the left hemisphere. Activity in a frontomedial (FrMed) area, the temporoparietal junction (TPJ), and anterior intraparietal sulcus (antIPS) was stronger in response to the rare compared with the frequent tones {P [Bonferroni corrected (corr)] < 0.0001}. The insets show average time courses (stimulus onset = 0 s) for the FrMed and antIPS for the rare tones preceded (red line) or not preceded (green line) by a TMS pulse. spTMS, single-pulse TMS.
