
Fig. 3.
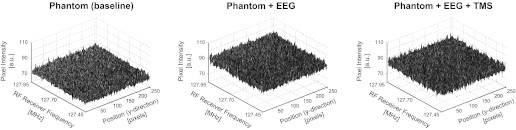
RF noise measurements. Summary plots of the mean pixel intensity averaged across the x-direction of the images to visualize the possible presence of interfering RF noise (i.e., a bright stripe indicating RF noise in the raw images would show up here as a peak in the plotted surface). No RF noise was detected for any of the tested setups (i.e., all 3 plots show rather homogeneous surfaces without isolated peaks in mean intensity values). a.u., Arbitrary units.