
Fig. 6.
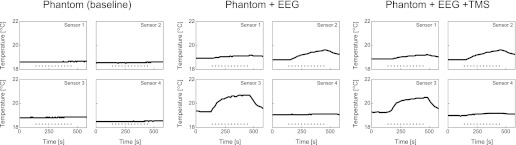
Temperature measurements. The plots show continuous temperature measurements from 4 different recording sites for all 3 setup configurations. Data were acquired before (2 min), during (5.6 min; represented by dotted horizontal line), and after (2 min) MR scanning. Importantly, temperature fluctuations were limited to a maximal temperature increase (ΔT) of 1.4°C, and adding TMS (right) did not lead to additional increases compared with the measurements with EEG in isolation (middle).