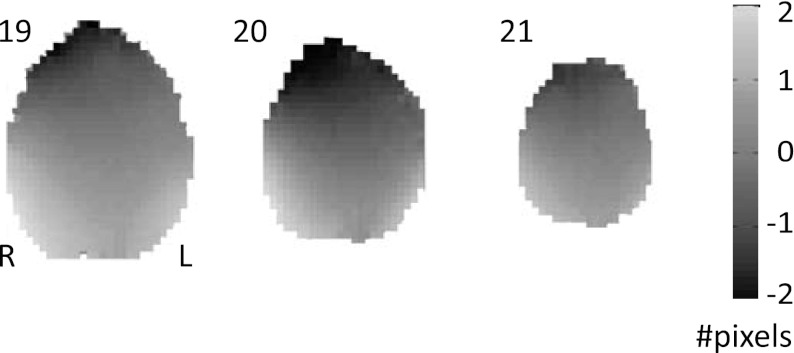
Fig. 8.
Voxel displacement map. The upper 3 slices (cf. slices 19-21 in Fig. 7) of the estimated voxel displacement map, which can be used to undistort EPI images. Since distortions were only minimal in the areas of interest, activation maps based on undistorted (i.e., corrected for susceptibility distortions) and distorted (i.e., uncorrected) images were rather similar. To stay as close as possible to the original data, Fig. 9 presents the uncorrected images.

