
Fig. 9.
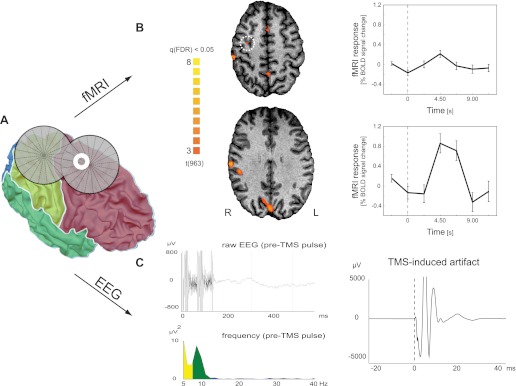
Human EEG and functional MRI (fMRI) data (resting state). Hemodynamic and electrical responses to single-pulse TMS to the right premotor cortex. A: TMS coil and premotor electrode “E8” (white annulus) position shown on the reconstruction of the participant's gray-white matter boundary surface. Surface colors indicate the 4 lobes. The TMS coil was positioned perpendicular to the main axis of the precentral sulcus, targeting the dorsal premotor cortex (schematically illustrated by the intersection of the 2 coil windings representing the main focus of the TMS coil). B: TMS-induced blood oxygenation level-dependent (BOLD) activations. Maps on transverse slices show regions with increased activation following TMS compared with resting baseline {q [false discovery rate (FDR)] < 0.05}. A less-pronounced local response could also be identified in the targeted dorsal premotor cortex (indicated by white dotted circle) when lowering the statistical threshold [t(963) = 2.24; P (uncorrected) < 0.025]. As exemplars, the plots on the right show average time courses for the right dorsal premotor cortex (top) and precuneus (bottom), respectively. The vertical dotted line represents the time of TMS delivery. Error bars indicate standard error of mean. C: EEG recordings from electrode E8 (spherical coordinates: θ, 49.04; φ, 67.24; see also A). The top left shows the raw data of a single trial. In the 1st 150 ms, the gradient artifact is clearly visible (collection of the last 2 slices). The subsequent period (followed by the TMS pulse and the subsequent MR volume acquisition; data not shown) is artifact-free (except for the non-TMS-related ballistocardiogram artifact) and shows strong similarity to resting-state signals in simultaneous EEG-fMRI studies. Also, the fast Fourier transform (FFT)-frequency spectrum of all pre-TMS pulse periods of 1 run (bottom left) shows similar results to simultaneous EEG-fMRI studies with high power in the α-range (and in addition in the δ-θ range, most likely representing the ballistocardiogram artifact). Note that the frequency spectrum of the same period in events where no TMS pulse was applied is identical to this plot depicting the pre-TMS pulse period (data not shown). Finally, the right plot illustrates the strong TMS-induced artifact (grand average over all TMS events; time of TMS pulse delivery represented by dotted vertical line).