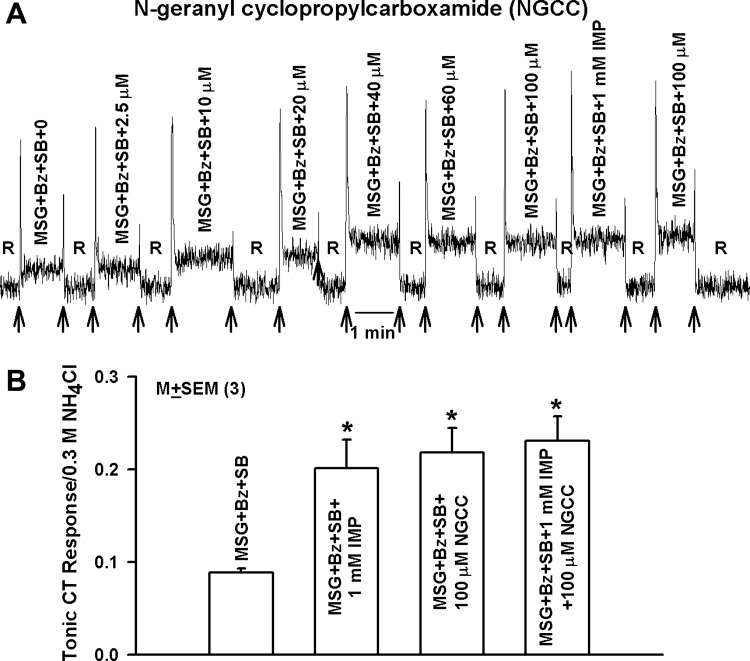
Fig. 4.
CT responses to monosodium glutamate (MSG), MSG+ inosine 5′-monophosphate (IMP), MSG+NGCC, and MSG+IMP+NGCC. A: representative CT trace in which the rat tongue was first stimulated with R and then with MSG+Bz+SB, MSG+Bz+SB+IMP (1 mM), and MSG+Bz+SB+NGCC (2.5–100 μM) maintained at room temperature with the stimulus series 4 protocol. Arrows show time period when the tongue was superfused with R and stimulating solutions. B: normalized mean ± SE tonic CT response from 3 animals for MSG+SB+Bz, MSG+SB+Bz+1 mM IMP, MSG+SB+Bz+100 μM NGCC, and MSG+SB+Bz+1 mM IMP+100 μM NGCC. *P values for mean MSG+Bz+SB CT response in the presence of 1 mM IMP, 100 μM NGCC, and 1 mM IMP+100 μM NGCC were 0.0226, 0.0085, and 0.0065, respectively, relative to MSG+Bz+SB (paired; n = 3).

