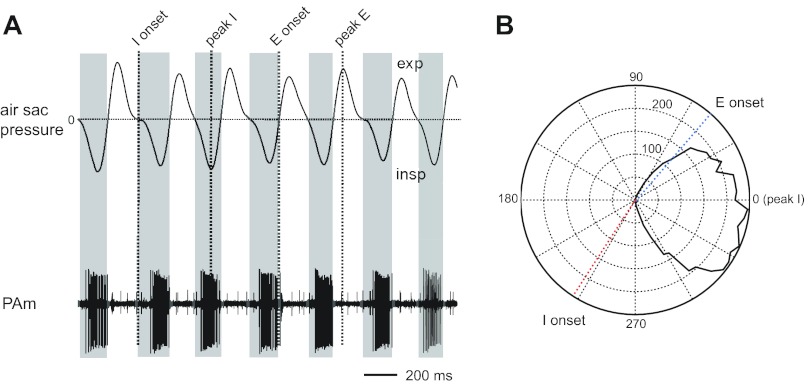
Fig. 2.
Air sac pressure recording and PAm unit activity. A: expiration leads to a positive deflection in the air sac pressure trace, and inspiration is indicated by a negative deflection. Air sac pressure markers: I onset, onset of inspiration; peak I, inspiratory peak; E onset, onset of expiration; peak E, peak expiration. B: polar plot of PAm unit activity counted in a 120-s trace at different phases of respiration. Respiratory phase plots were generated by binning spikes with respect to the cyclical occurrence of the peak in the inspiratory phase, which occurs at 0° in the polar plot.

