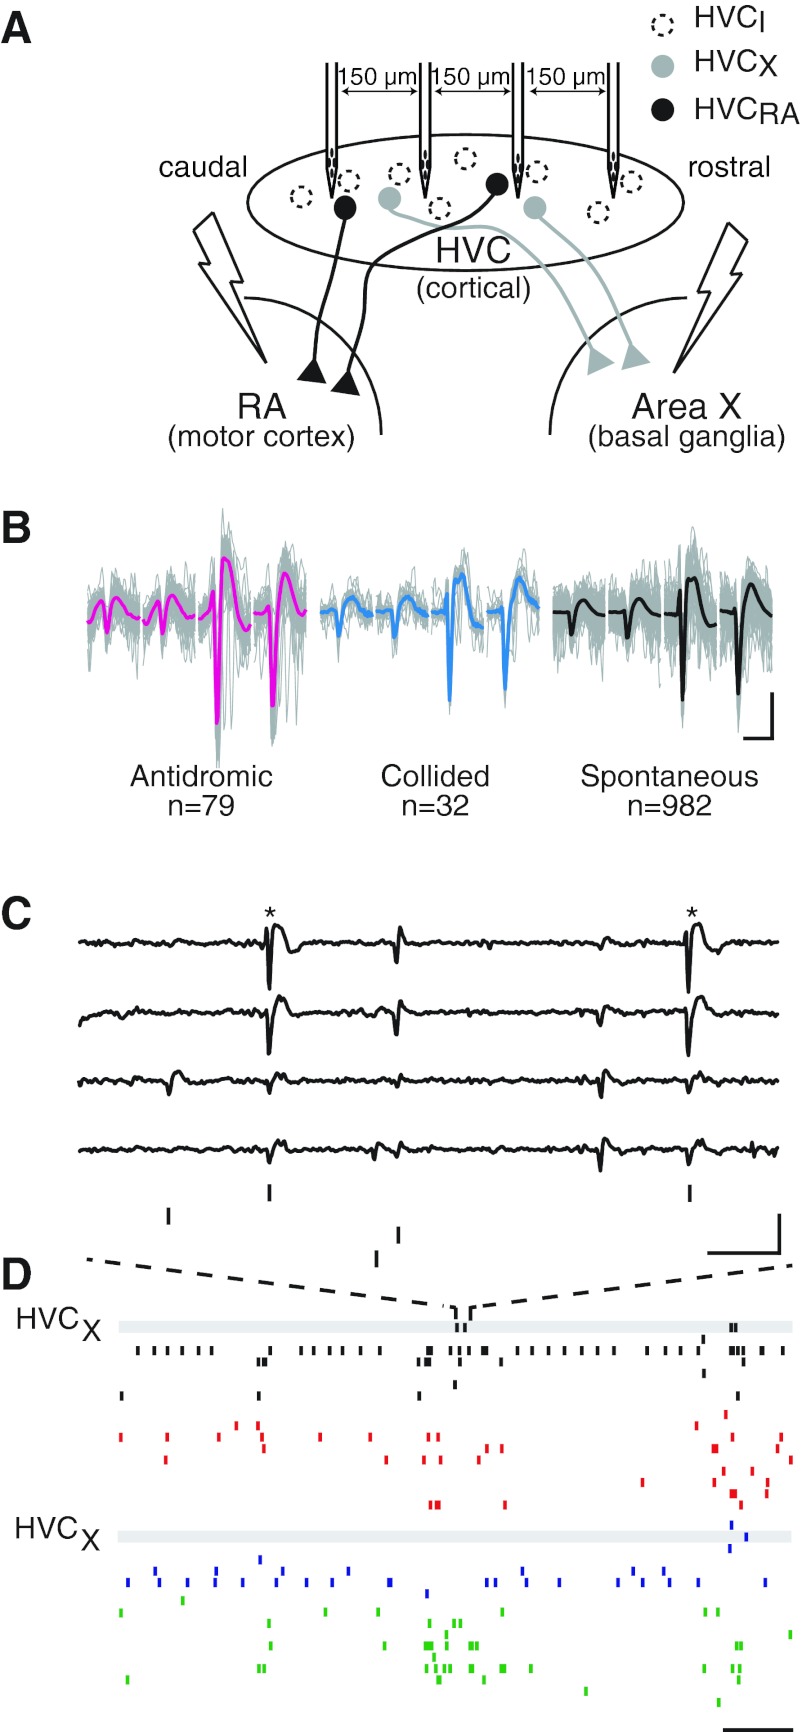
Fig. 3.
The recording configuration enabled the monitoring of multiple units across the HVC. A: diagram of the recording and stimulation configuration showing the linear four-tetrode array within the HVC. Bipolar stimulating electrodes were placed in the following song nuclei: robust nucleus of the arcopallium (RA) and area X. HVCX, HVC unit that projects to area X; HVCRA, HVC unit that projects to the RA. B: waveforms of spikes from an area X-projecting neuron were identified with spike sorting methods. Each image shows overlaid traces of clustered spikes of a single unit recorded on each of four electrodes (gray, with their means in color) that are shown separately based on whether they were driven by antidromic stimulation, occurred spontaneously and resulted in a collision with an antidromically driven spike, or occurred spontaneously during the period with no stimulation. Antidromic spikes (left; mean in red), spontaneous spikes that resulted in collisions (middle; mean in blue), and spontaneous spikes that occurred in the absence of stimulation (right; mean in black) were similar enough to cocluster with each other based on established methods (Day et al. 2011). The number of waveforms from each group are listed below each image. Scale bar = 1 ms, 250 μV. C: raw voltage traces from the four channels of one of four tetrodes are aligned with the spike times of four clustered units. Here, the unit that was identified as area X projecting in B (*) fired twice, along with three other clustered neurons. Scale bar = 3 ms, 400 μv. D: raster plots of spike times for the units shown in D on a longer timescale are temporally aligned with the activities of units on three other tetrodes. The tetrodes are ordered caudal to rostral, with different colors indicating different tetrodes. The activities of HVCX units are highlighted with gray bars. Scale bar = 15 ms.

