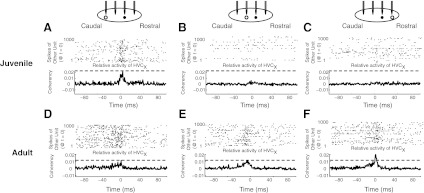
Fig. 4.

Coherency analysis reveals spike train relationships of single neurons in the HVC. Examples are shown from a juvenile (A–C) and an adult (D–F). In A–F, examples of coherency relationships between a HVCX and another neuron are plotted below schematics that show the rostrocaudal relationship of the HVCX (●) and its partner neuron (○) and dot rasters that show the first 1,000 spike times of the HVCX relative to the partner that spiked at time (t) = 0. For aid in visual alignment, gray dashed lines indicate the peak coherency in the left graph. The bin size for the dot rasters and coherency calculation was 1 ms. A–C: spiking activity and coherency of a juvenile HVCX single unit relative to other single units that were 300 μm caudal, 150 μm caudal, or 150 μm rostral, respectively. D–F: activity and coherency of an adult HVCX single unit relative to single units that were 300 μm caudal, 150 μm caudal, or 150 μm rostral, respectively.
