
Fig. 4.
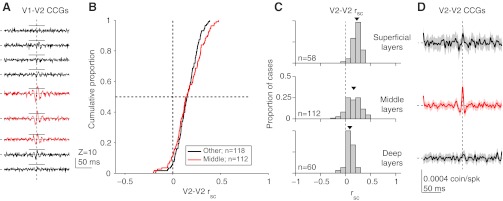
Dependence of correlations in V2 on laminar location. A: jitter-corrected CCGs (averaged across all pairs) at 9 sites spaced by 0.25 mm, recorded in 1 V2 penetration with neurons simultaneously recorded in the superficial layers of V1. Significant sharp peaks were evident in the population-average V1-V2 CCGs at the 3rd–5th sites (indicated in red); horizontal solid lines indicate criterion level of 5 SDs. These CCGs are Z-scored, relative to the mean and SD of their values at time lags of 75–125 ms, to indicate directly which cases are deemed to be significant. The horizontal and vertical dashed lines indicate 0% synchrony and zero time lag, respectively. B: using the presence of sharp peaks as an indicator of the middle layers of V2, these cumulative distributions of rsc show values for middle (red) and other (black) layers. C: histograms for rsc values at superficial, middle, deep layer sites. D: for the same pairs shown in C, average jitter-corrected CCGs in the superficial, middle and deep layers. Shaded region around lines indicates ±1 SE.