
Figure 2.
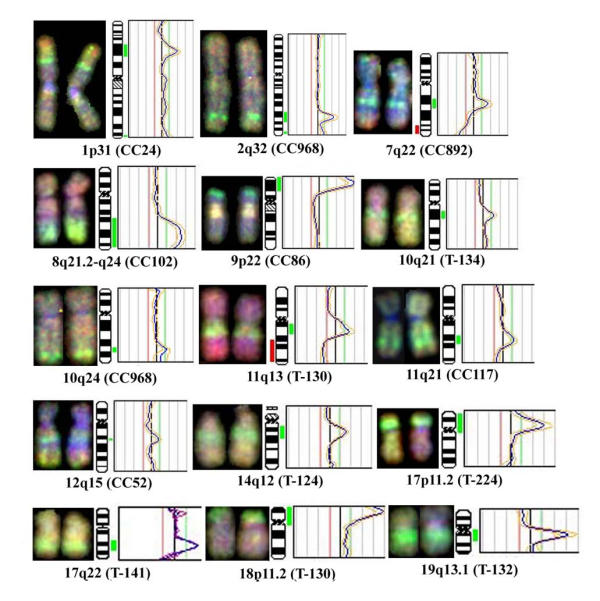
Chromosomal amplifications identified by CGH in CC. Partial CGH karyotypes (left) and corresponding ratio profiles (right) illustrating 15 amplified chromosomal regions in CC. The blue line in the ratio profiles represents the mean of 8 to 10 chromosomes, and the yellow lines indicate the standard deviation. The vertical red and green bars on the left and right of the ideogram indicate threshold values of 0.80 and 1.20 for loss and gain, respectively. A threshold value of 2.0 or more indicates amplifications.