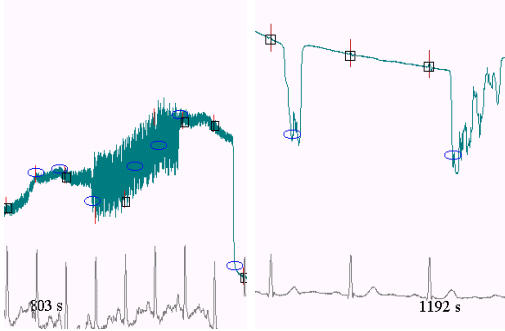
Figure 8.

Automatic efficiency assessment of the algorithm. The vertical red dashes show annotated normal QRS complexes. The blue small ellipses are for detected EB. The black rectangles delineate the window wherein the algorithm has missed VB. Time-marks are inserted into the signals.
