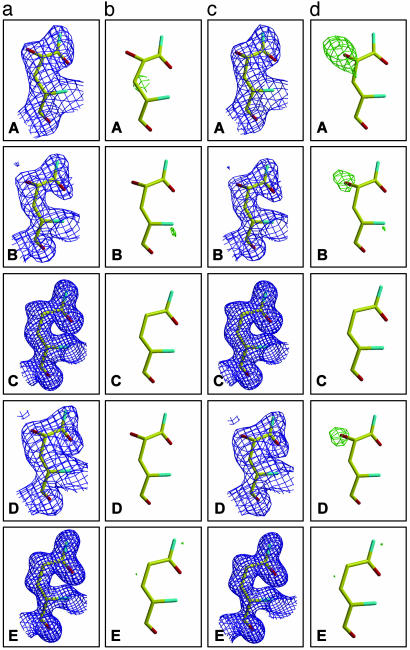
Fig. 3.
Fourier electron density maps around GlnH6 in 4C6 Fab: for data sets A to E as described for Fig. 2. For a and b, the glutamine residue was modeled and refined as γ-hydroxyglutamine for data sets A, B, and D and modeled and refined as glutamine for control data sets C and E. As a control (c and d), the glutamine residue was modeled and refined as glutamine for all data sets. (a) 2Fo – Fc maps (blue), contoured at 1.0 σ. (b) Fo – Fc maps, contoured at 3.0 σ (green) and –3.0 σ (red). (c)2Fo – Fc maps (blue), contoured at 1.0 σ.(d) Fo – Fc maps, contoured at 3.0 σ (green).

