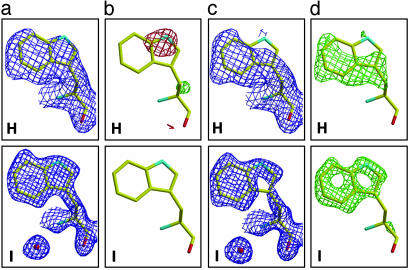
Fig. 4.
Fourier electron density maps showing TrpL163 in 13G5 Fab for UV-irradiated data set H and native control data set I. For a and b, the tryptophan residue was refined as tryptophan, whereas for control (c and d), the tryptophan residue was refined as alanine to avoid model bias. (a) 2Fo – Fc maps (blue), contoured at 1.0 σ.(b) Fo – Fc maps, contoured at 3.0 σ (green) and –3.0 σ (red). (c)2Fo – Fc maps (blue), contoured at 0.8 σ.(d) Fo – Fc maps, contoured at 3.0 σ (green).

