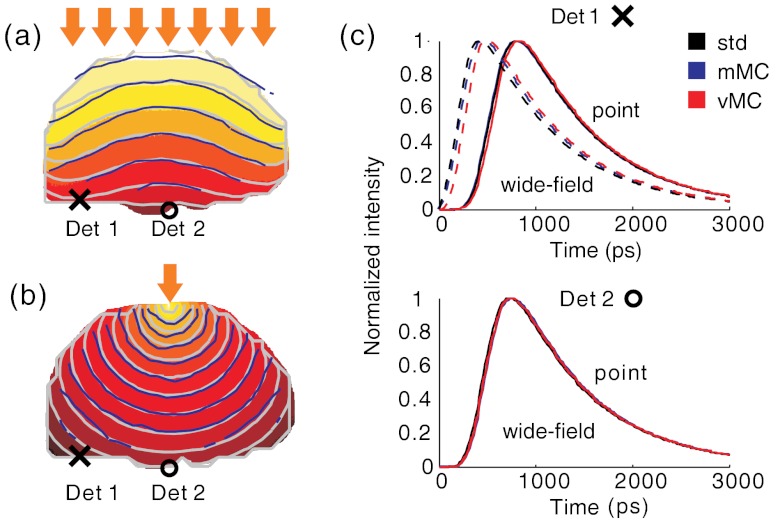
Fig. 6.
Forward simulation comparison for (a) widefield and (b) point source illumination. mMC: blue, vMC: gray; high-resolution standard (std): solid-color-filled contours (background). (c) The normalized time-resolved detector readings (black crosses and circles in (a) and (b). The solid and dashed lines represent the TPSFs in the point source and widefield simulations, respectively. In the bottom figure the dashed and solid lines are overlapped due to similar detector responses for simulations with the point source and the widefield source.

