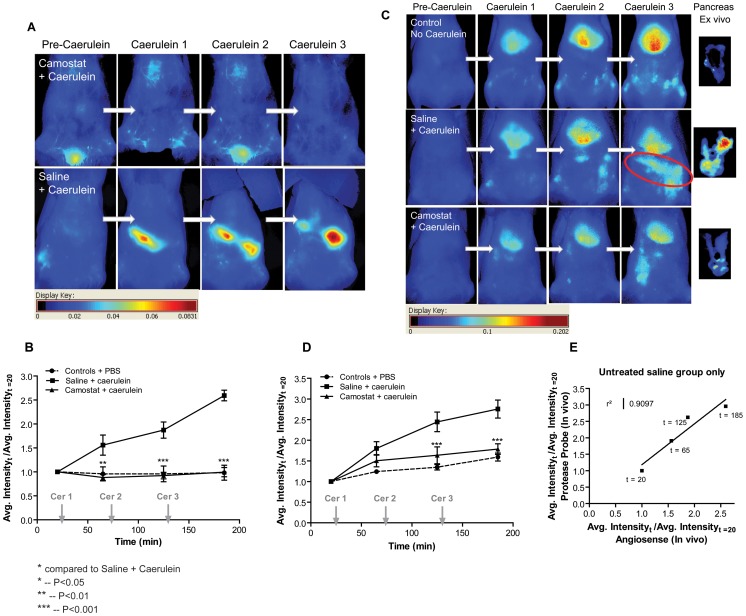
Figure 3. In vivo study with trypsin and serine protease activity inhibitor Camostat.
A) Animals were administered Camostat at 300 mg/kg orally 24 h and 2 h prior to imaging study. Blood pool fluorescent contrast agent Angiosense was administered intravenously and animals were imaged at different times during a 3 h study with Caerulein induced pancreatitis to assess the development of edema. B) (n = 3) The graph is a quantification of the fluorescent intensity corresponding to the time points in A) and normalized to image obtained prior to caerulein administration. C) Another set of animals was administered the mPEG-PL-Cy5.5 probe to monitor the activity of trypsin in caerulein induced pancreatitis animals. D) (n = 6) The signal in the pancreas was quantified and plotted. Data represented mean ± SEM. E) Untreated saline animal average normalized fluorescent intensity from the Angiosense animals and mPEG-PL-Cy5.5 probe was plotted.

