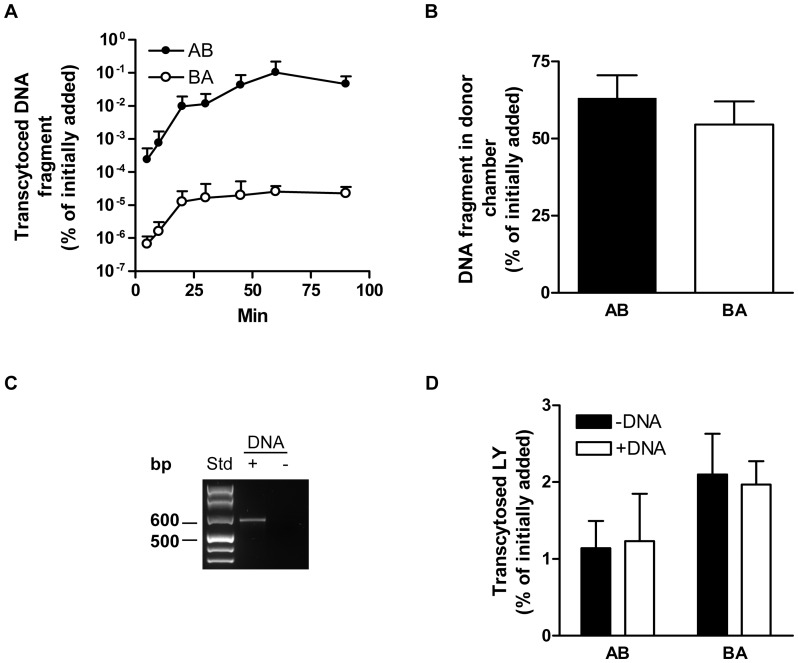
Figure 1. Time-course of DNA-fragment transport across CaCo-2 cells.
CaCo-2 cells on filters were incubated with a 633 bp long polymerase chain reaction (PCR) amplified fragment and Lucifer yellow (LY) at 37 °C and samples were collected at the time points indicated. A: The amount of DNA-fragments transported across the cells in the apical to basolateral (A B) direction and the B
 A direction was quantified by real-time PCR (qPCR) and normalized to the amount of DNA initially added to the cells and plotted against time. B: The amount of DNA-fragment left in the donor chambers after 90 min of incubation was quantified by qPCR and normalized to the amount of DNA initially added. C: All liquid in the basolateral donor chamber was collected from two wells and pooled before purification of DNA. PCR using the primers RRS SphI F and RRS SphI R was performed on the purified DNA before visualization on a 2% agarose gel to detect the full length DNA-fragment. D: After 90 min of incubation the amount of transcytosed LY was normalized to the amount of initially added LY in wells with or without addition of DNA-fragment. In A, B and D, the data shown are from one representative experiment with three replicates, showing mean +/−SD.

