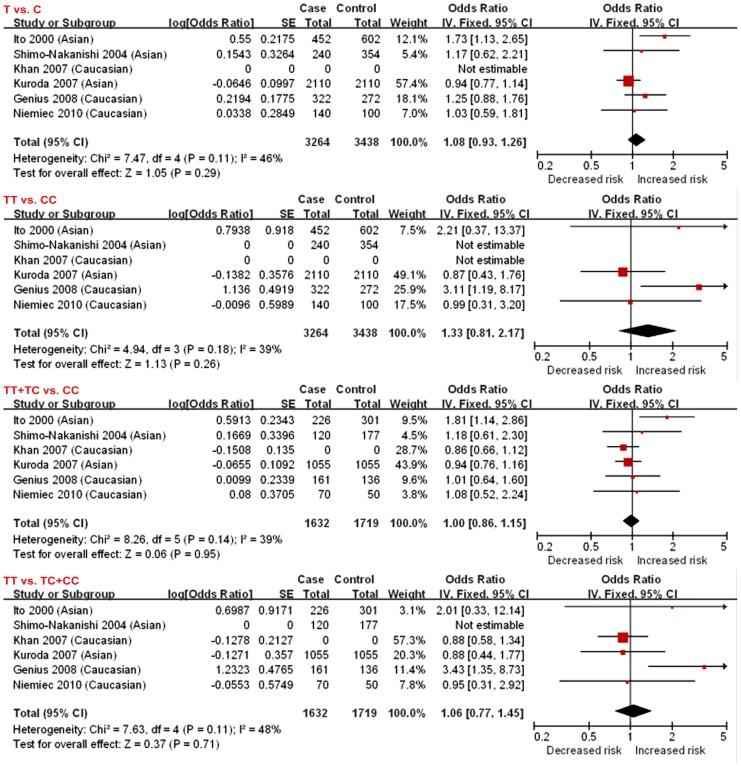
Figure 2. Forest plots for overall studies.
Fixed effects models were used as no statistical heterogeneity across studies were observed (I2 = 46%, p = 0.11; I2 = 39%, p = 0.18; I2 = 39%, p = 0.14; I2 = 48%, p = 0.11, respectively). There was no statistical evidence of association (T vs. C: OR = 1.08, 95%CI = 0.93–1.26; TT vs. CC: OR = 1.33, 95%CI = 0.81–2.17; TT+TC vs. CC: OR = 1.00, 95%CI = 0.86–1.15; and TT vs. TC+CC: OR = 1.06, 95%CI = 0.77–1.45). se: standard error; IV: inverse variance; CI: confidence interval.

