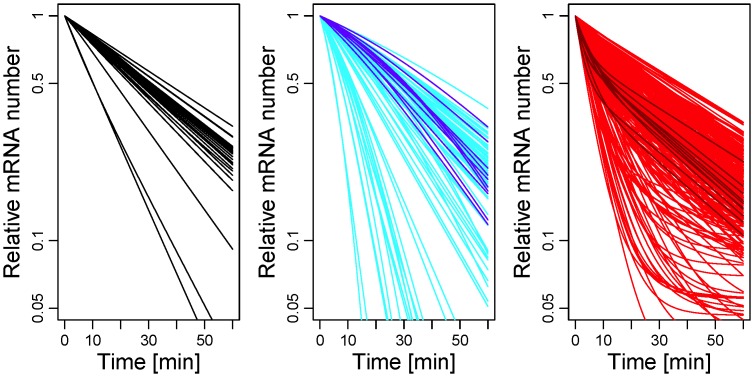
Figure 5. mRNA decay patterns in S. cerevisiae.
The patterns are obtained from a systematic fitting procedure applying Eqs. (1) and (9) or (10) to the experimental data from Ref. [23]. The curves show the theoretical decay patterns that minimize the deviation between theory and experiment. Note that the experimental data points are omitted here for better legibility. The left panel shows 21 fitted curves that decay exponentially in good approximation (the best fit was either an exponential function or fitting by another function leads to an error reduction of less than 10 per cent). Conversely, 94 curves show a moderate decay followed by a fast decay (central panel, the best fit was obtained by Eq. (10) with  ) and 309 curves decay rapidly at short times and then level off (right panel, the best fit was obtained by Eq. (9) with
  ). Thus, the majority of decay patterns does not follow a single-exponential decay law. For this visualization of the different categories, we considered data that were nearly bona-fide (see text) resulting in 424 genes. Moreover, in the central and right panel we highlighted a number of decay patterns that display a strong contrast to an exponential decay.

