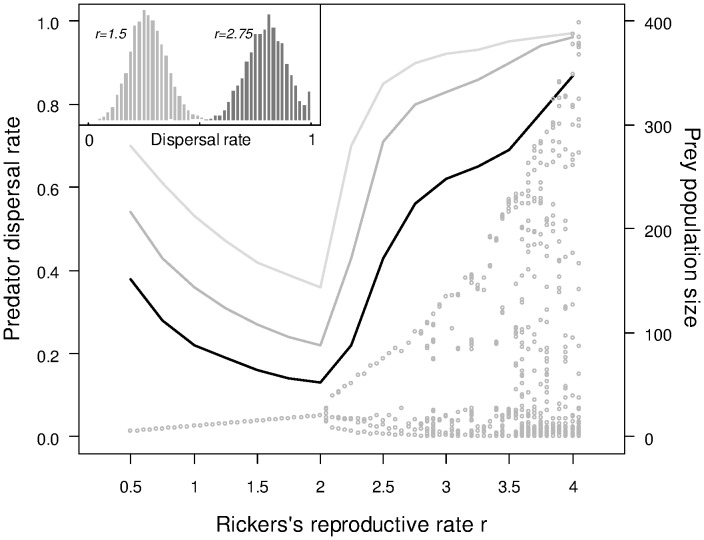
Figure 1. Evolution of predator emigration probability.
Average predator emigration probabilities obtained after the model stabilized (left y-axis) for a range of r between 0.5 and 4.0 (by increments of 0.5). The three lines represent three different mortality costs of dispersal imposed on predators (from light grey to black: c = 0.05, 0.1, 0.2 respectively, see Methods). The bifurcation diagram shows the distribution of stable limits of the prey dynamics for the range of r values (right y-axis).The extent of variation in predator emigration probability at the population level is shown for two sets of simulations in the inserted panel (cost of dispersal c = 0.1 for both).

