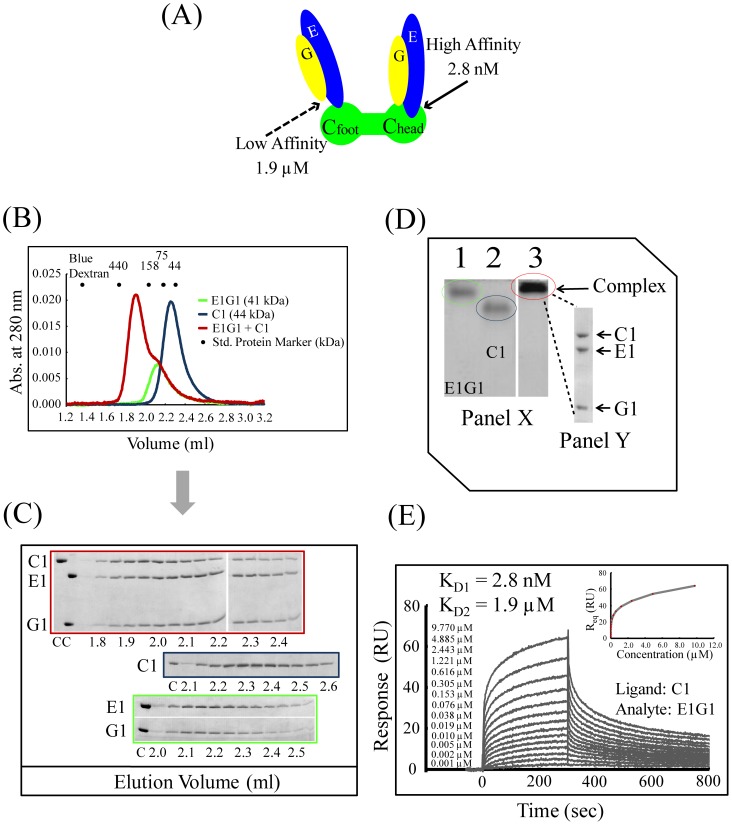
Figure 2. Interactions between E1G1 and C1.
(A) Mode of E1G1-C1 binding interaction in vitro based on data reported from previous studies of yeast [11]. Using a Biacore system, the KD values for affinities of C1head-E1G1 and C1foot-E1G1 were estimated to be 2.8 nM and 1.9 µM, respectively, as shown in 2D. (B) Gel filtration profile of E1G1/C1 complex formation (red) in comparison with E1G1 (green) and C1 (blue) monomers. (C) SDS-PAGE analysis of the eluted fractions from gel filtration chromatography. Gel border colors indicate samples corresponding to the color scheme used in 2B. “C” indicates control proteins. (D) Panel X: Basic native polyacrylamide gel electrophoresis analysis of E1G1 and C1 interaction. For complex formation, a 2∶1 molar ratio of E1G1:C1 proteins was prepared and incubated on ice for 1 h (lane 3). Bands corresponding to one molar amount of E1G1 and C1 are visible in lanes 1 and 2, respectively. Panel Y: SDS-PAGE (12% gel) analysis of the E1G1C1 complex band eluted from the native gel in panel X (lane 3). (E) Real-time binding evaluation was performed using a Biacore system. Sensorgrams for the binding of various concentrations of the analyte (E1G1) to the ligand (C1) are shown. The inset curve shows the steady-state binding isotherm for binding of E1G1 at various concentrations to C1 ligand on a CM5 sensor chip.

