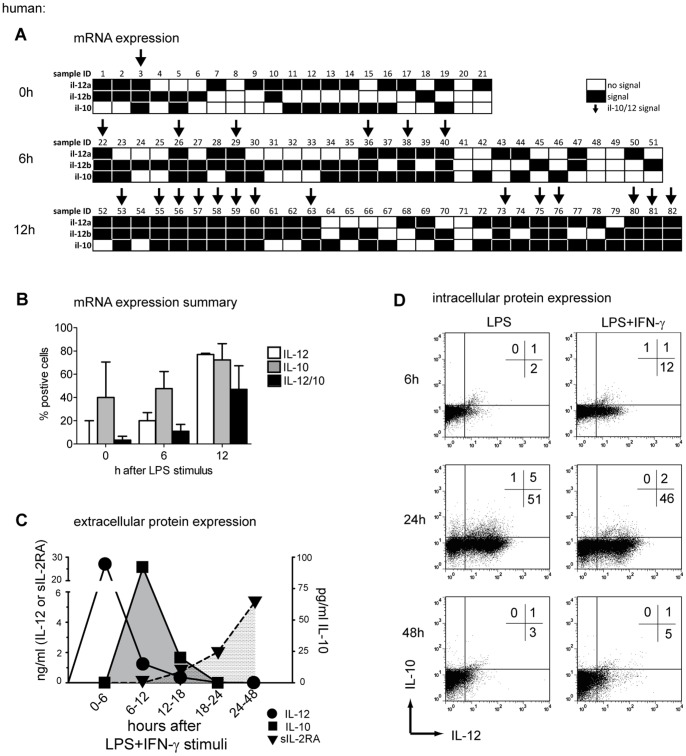
Figure 5. Production of IL-12 and IL-10 on a single-cell level in DCs.
(A) Real-Time PCR was used to assess IL-12p35, IL-12p40 and IL-10 mRNA on single cell levels before and after 6 or 12 hours exposure to LPS. All b2m positive sorted single cells were further analyzed for IL-12p35, IL12-p40 and IL-10. Every single cell is depicted (sample ID) for signal (black), no signal (white) and mRNA signal of all three targets (arrow). (B) The summary of 3 independent experiments is depicted as median±SEM. Bars represent the percentage of IL-10 (grey bars), IL-12 (white bars, p35/p40 double positive signals) or IL-10/IL-12 double producing cells (black bars). (C) The concentration of freshly secreted IL-12 (circles), IL-10 (squares), and soluble IL-2RA (triangles) from LPS/IFN-γ activated human DCs is shown in 6 hours intervals after LPS/IFN-γ maturation. At each time point the entire medium was exchanged in order to assess only freshly produced cytokines during the respective time intervals. One representative out of 3 experiments is shown. (D) Intracellular staining of IL-10 and IL-12 protein before and after 6, 24, and 48 hours of exposure to LPS or LPS/IFN-γ. Quadrants are adjusted to the fluorescence of antibody-labeled immature DCs. One representative experiment of 2 is shown. DCs from Donor A and F were used in experiment (A) to (D).

