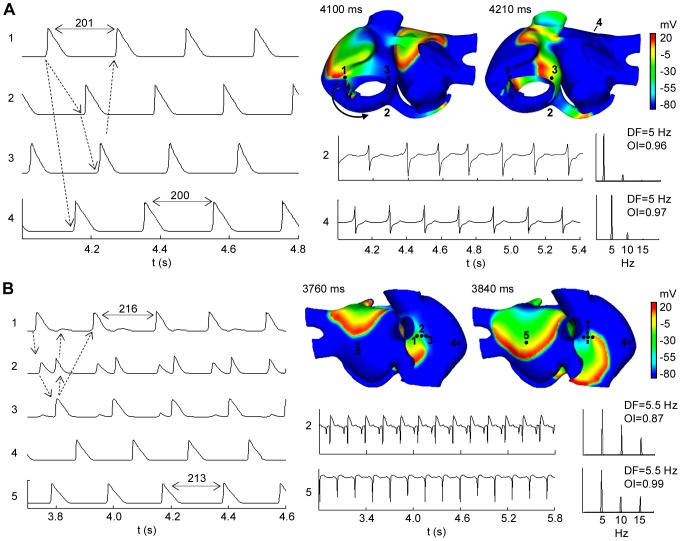
Figure 5. Flutter and reentrant tachycardia episodes. Snapshots, APs, EGM and spectral analysis in selected points.
(A) Atrial flutter and (B) reentrant tachycardia episodes. In the snapshots, the color scale represents the range of values of the AP in mV. The depolarizing front is identified by the red color. The black arrow indicates the wavefront direction and the dash line a blocking line. AP time-courses of selected sites (indicated in the snapshots) are showed at the left, the dotted arrows indicate the activation sequence. EGM and their spectral analysis showing DF and OI values are shown (See text for more details).

